[论文解读] Time Series as Images: Vision Transformer for Irregularly Sampled Time Series
ViTST 将不规则采样的多变量时间序列转换为折线图图像,并对预先训练的视觉Transformer进行微调以用于分类,达到最先进的结果并对缺失数据具有鲁棒性。
Irregularly sampled time series are increasingly prevalent, particularly in medical domains. While various specialized methods have been developed to handle these irregularities, effectively modeling their complex dynamics and pronounced sparsity remains a challenge. This paper introduces a novel perspective by converting irregularly sampled time series into line graph images, then utilizing powerful pre-trained vision transformers for time series classification in the same way as image classification. This method not only largely simplifies specialized algorithm designs but also presents the potential to serve as a universal framework for time series modeling. Remarkably, despite its simplicity, our approach outperforms state-of-the-art specialized algorithms on several popular healthcare and human activity datasets. Especially in the rigorous leave-sensors-out setting where a portion of variables is omitted during testing, our method exhibits strong robustness against varying degrees of missing observations, achieving an impressive improvement of 42.8% in absolute F1 score points over leading specialized baselines even with half the variables masked. Code and data are available at https://github.com/Leezekun/ViTST
研究动机与目标
- 通过将数据可视化为图像来激发对不规则采样时间序列的简单、通用方法。
- 利用预训练的视觉Transformer来建模折线图图像中的时间动态与变量间关系。
- 展示在医疗保健和人类活动数据集上的先进性能和鲁棒性。
- 展示对不规则和规则时间序列的适用性,突出作为通用框架的多功能性。
提出的方法
- 将多变量不规则时间序列通过在网格布局中绘制每个变量的折线图,转换为单一的RGB图像。
- 使用每个变量具有一致刻度的折线图并通过颜色编码来区分变量。
- 在得到的图像上微调预训练的视觉Transformer(Swin Transformer)用于分类。
- 可选地通过RoBERTa编码静态人口统计/文本特征并与图像嵌入拼接。
- 在leave-sensors-out设置下评估以测试对缺失变量的鲁棒性。
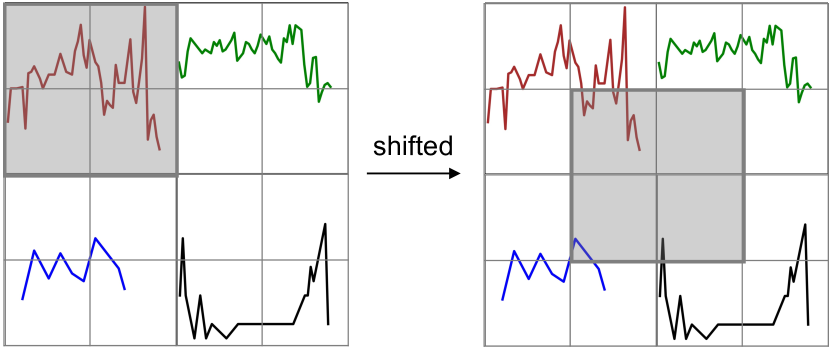
![Figure 1: An illustration of our approach ViTST. The example is from a healthcare dataset P12 [ 12 ] , which provides the irregularly sampled observations of 36 variables for patients (we only show 4 variables here for simplicity). Each column in the table is an observation of a variable, with the o](https://ar5iv.labs.arxiv.org/html/2303.12799/assets/x1.png)
实验结果
研究问题
- RQ1当输入被可视化为折线图图像时,基于自然图像训练的视觉Transformer是否能有效对不规则采样的时间序列进行分类?
- RQ2ViTST框架是否在缺失观测下具备鲁棒性并在医疗保健和活动数据集上维持性能?
- RQ3网格布局、图像分辨率和绘图细节如何影响性能?
- RQ4该方法在应用到规则时间序列数据以及包含静态特征时是否具有竞争力?
主要发现
- ViTST在P19上实现89.2% AUROC和53.1% AUPRC,在P12上实现85.1% AUROC和51.1% AUPRC,优于最先进的不规则时间序列方法。
- 在PAM数据集上,ViTST达到95.8% accuracy、96.2% precision、96.1% recall和96.5% F1分数。
- ViTST在AUROC/accuracy指标上整体领先基线2.2–7.3个百分点。
- 在leave-sensors-out条件下,ViTST保持强劲表现,并在F1分数上领先基线高达42.8%。
- 预训练的视觉Transformer(ViT/Swin)相较从头训练带来显著提升,表明从自然图像到折线图时间序列图像的有效迁移。
- 消融研究显示对绘图变体具有鲁棒性;颜色编码和逐变量折线图对性能重要。
更好的研究,从现在开始
从论文设计到论文写作,大幅缩短您的研究时间。
无需绑定信用卡
本解读由 AI 生成,并经人工编辑审核。