
[论文解读] Uncertain Quality-Diversity: Evaluation methodology and new methods for Quality-Diversity in Uncertain Domains
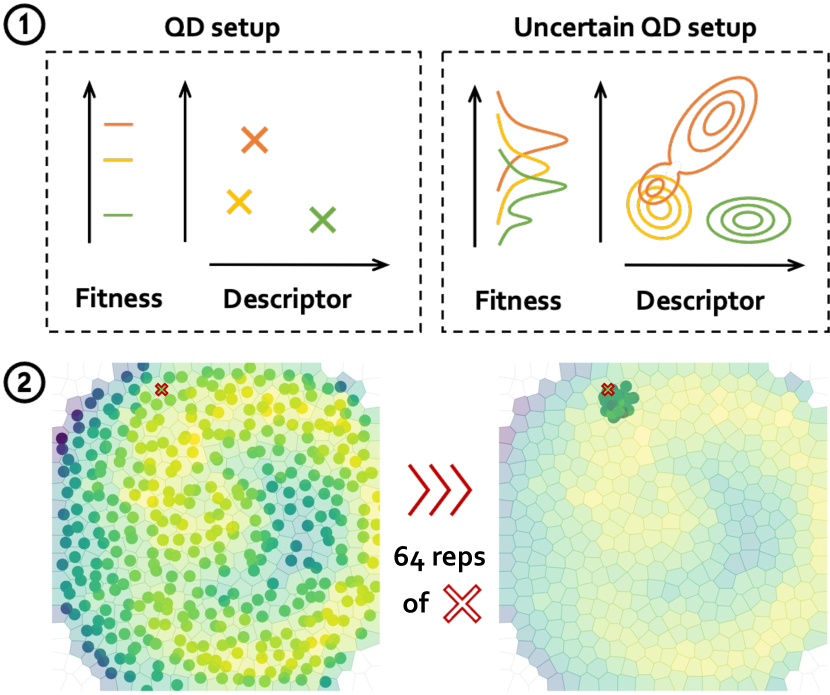
本文提出了不确定质量-多样性(Uncertain QD)框架,为在不确定环境中进行质量-多样性优化提供正式化方法,其中适应度和描述符为概率分布而非固定值。该研究提出了一种基于每代采样预算的新评估方法,并引入三种新算法——归档采样(Archive-sampling)、并行自适应采样(Parallel-Adaptive-sampling)和深度网格采样(Deep-Grid-sampling),在不确定环境中显著提升了方案的可重现性与鲁棒性,优于标准MAP-Elites算法。
Quality-Diversity optimisation (QD) has proven to yield promising results across a broad set of applications. However, QD approaches struggle in the presence of uncertainty in the environment, as it impacts their ability to quantify the true performance and novelty of solutions. This problem has been highlighted multiple times independently in previous literature. In this work, we propose to uniformise the view on this problem through four main contributions. First, we formalise a common framework for uncertain domains: the Uncertain QD setting, a special case of QD in which fitness and descriptors for each solution are no longer fixed values but distribution over possible values. Second, we propose a new methodology to evaluate Uncertain QD approaches, relying on a new per-generation sampling budget and a set of existing and new metrics specifically designed for Uncertain QD. Third, we propose three new Uncertain QD algorithms: Archive-sampling, Parallel-Adaptive-sampling and Deep-Grid-sampling. We propose these approaches taking into account recent advances in the QD community toward the use of hardware acceleration that enable large numbers of parallel evaluations and make sampling an affordable approach to uncertainty. Our final and fourth contribution is to use this new framework and the associated comparison methods to benchmark existing and novel approaches. We demonstrate once again the limitation of MAP-Elites in uncertain domains and highlight the performance of the existing Deep-Grid approach, and of our new algorithms. The goal of this framework and methods is to become an instrumental benchmark for future works considering Uncertain QD.
研究动机与目标
- 正式建立不确定领域中质量-多样性优化的统一框架,其中适应度和描述符为可能取值的概率分布而非固定值。
- 解决标准QD算法(如MAP-Elites)在不确定环境中因精英主义倾向而偏向幸运评估结果的局限性。
- 提出一种新评估方法,以采样规模替代批次大小,考虑每代的采样预算,实现对不确定性处理策略的公平比较。
- 设计并评估新型Uncertain QD算法,利用高并行化与采样策略,提升解决方案的可靠性与多样性。
- 通过开源工具与标准化评估协议,为未来Uncertain QD研究建立基准。
提出的方法
- 将不确定QD设定形式化为QD的一个特例,其中适应度与描述符为可能取值的概率分布。
- 引入“采样规模”作为算法比较中批次大小的替代指标,表示每代对每个方案的总评估次数。
- 提出一种新的评估流程,包括每代采样、对方案的重复评估,以及基于分布的指标计算。
- 开发三种新算法:归档采样(从归档中采样方案进行评估)、并行自适应采样(基于方差按单元自适应调整采样)、深度网格采样(使用神经网络建模分布并策略性采样)。
- 采用QD-Score、可重现性得分及适应度/描述符方差等指标,评估不同任务下性能与鲁棒性。
- 通过QDax与EvoJax等库实现高并行化,支持高效的基于采样的评估,使采样成为模型化不确定性处理的可行替代方案。
实验结果
研究问题
- RQ1如何正式扩展质量-多样性优化,以处理适应度与描述符取值中的不确定性?
- RQ2当评估成本因采样而变化时,如何公平比较不确定QD算法?
- RQ3基于采样的方法与基于模型或自适应策略相比,在方案质量、多样性与可重现性方面表现如何?
- RQ4在不确定环境中,哪种算法设计——均匀采样、自适应采样或分布建模——能产生最鲁棒且多样的解决方案?
- RQ5当高并行化使采样成本可接受时,简单采样策略是否能超越更复杂的模型化方法?
主要发现
- 由于精英主义倾向偏向幸运评估,MAP-Elites在不确定环境中失效,导致选择不可重现的方案。
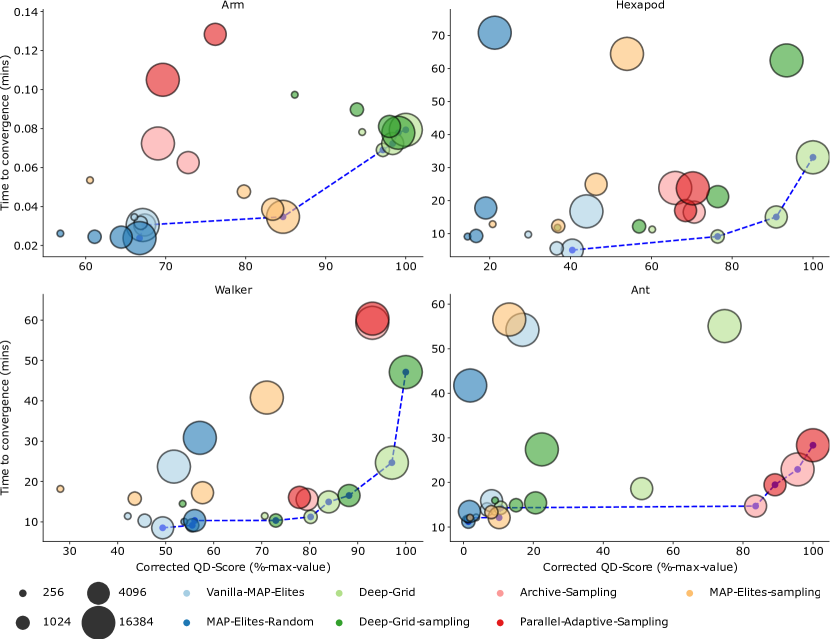
- 归档采样与并行自适应采样在可重现性方面显著优于MAP-Elites与MAP-Elites-Random(p < 1.10⁻³),通过降低方案性能方差实现。
- 在Walker任务中,深度网格采样在QD-Score上优于其他方法(采样规模256时,p < 5.10⁻²),在简单任务中也表现出色。
- 深度网格采样在噪声结构简单的环境中表现良好,但在复杂噪声下表现不佳,表明其在分布近似方面存在局限。
- 尽管使用了采样,MAP-Elites-sampling在可重现性方面与标准MAP-Elites无异,原因在于缺乏探索与低效的采样策略。
- 归档采样与并行自适应采样在复杂任务(Ant与Walker)中实现了具有竞争力的QD-Score,优于深度网格采样,且展现出极强的可重现性。
更好的研究,从现在开始
从阅读论文到最终审阅,大幅缩短您的研究时间。
无需绑定信用卡
本解读由 AI 生成,并经人工编辑审核。