[论文解读] Very high resolution canopy height maps from RGB imagery using self-supervised vision transformer and convolutional decoder trained on Aerial Lidar
本论文提出一种自监督视觉变换器编码器,配合密集预测解码器,从Maxar RGB 图像生成非常高分辨率的冠层高度图,并通过 GEDI 基于全球尺度的重缩放进行精炼,在 NEON、CA-Brande 和 São Paulo 等地区的机载激光雷达数据上进行评估。
Vegetation structure mapping is critical for understanding the global carbon cycle and monitoring nature-based approaches to climate adaptation and mitigation. Repeated measurements of these data allow for the observation of deforestation or degradation of existing forests, natural forest regeneration, and the implementation of sustainable agricultural practices like agroforestry. Assessments of tree canopy height and crown projected area at a high spatial resolution are also important for monitoring carbon fluxes and assessing tree-based land uses, since forest structures can be highly spatially heterogeneous, especially in agroforestry systems. Very high resolution satellite imagery (less than one meter (1m) Ground Sample Distance) makes it possible to extract information at the tree level while allowing monitoring at a very large scale. This paper presents the first high-resolution canopy height map concurrently produced for multiple sub-national jurisdictions. Specifically, we produce very high resolution canopy height maps for the states of California and Sao Paulo, a significant improvement in resolution over the ten meter (10m) resolution of previous Sentinel / GEDI based worldwide maps of canopy height. The maps are generated by the extraction of features from a self-supervised model trained on Maxar imagery from 2017 to 2020, and the training of a dense prediction decoder against aerial lidar maps. We also introduce a post-processing step using a convolutional network trained on GEDI observations. We evaluate the proposed maps with set-aside validation lidar data as well as by comparing with other remotely sensed maps and field-collected data, and find our model produces an average Mean Absolute Error (MAE) of 2.8 meters and Mean Error (ME) of 0.6 meters.
研究动机与目标
- 促使并实现非常高分辨率的植被结构映射,以支持碳循环评估和 FLR 监测。
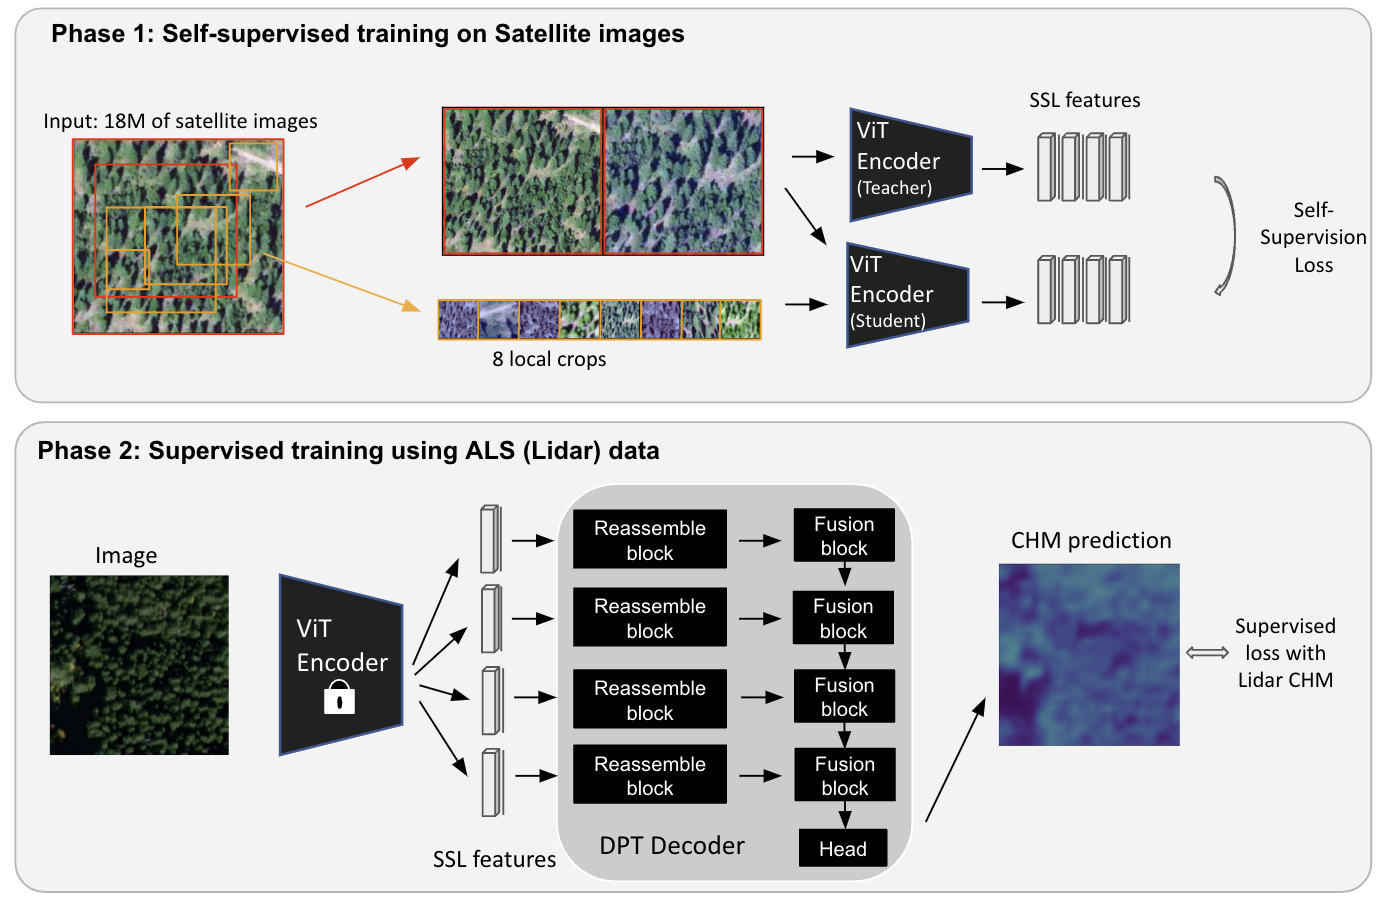
- 开发在全球 Maxar RGB 图像上进行训练的自监督编码器,以提取通用的植被特征。
- 在 aerial lidar(1 m CHM)上训练密集预测解码器,以预测逐像素的冠层高度。
- 用基于 GEDI 的全球校正来细化预测,以改善跨站点的泛化能力。
- 为加利福尼亚和São Paulo 提供高分辨率 CHMs,并与激光雷达及现有 CHMs 进行评估。
提出的方法
- 在 1800 万个 256x256 的 Maxar RGB 缩略图上训练一个大型自监督视觉变换器(ViT)编码器(SSL 阶段)。
- 在 SSL 特征之上训练一个 Dense Prediction Transformer(DPT)解码器,以预测高分辨率 CHMs(阶段 2)。
- 为树冠高度回归应用基于 Sigloss 的目标函数,并使用分箱/分类输出,以稳定训练。
- 在 128x128 的 RGB 片段上训练一个单独的 GEDI 基于卷积网络,以预测 GEDI RH95 作为全球校正。
- 从 GEDI 预测的 CHM 和基于 ALS 的百分位数计算密集校正因子 gamma(x),在推断时对 ALS 预测进行重缩放(后处理)。
- 与 ResUNet 基线及先前的 CHM 地图进行比较,并在 NEON、CA-Brande、São Paulo 数据集上进行验证。
实验结果
研究问题
- RQ1自监督特征是否能从高分辨率 RGB 图像泛化到跨生境的准确冠层高度估计?
- RQ2将 SSL 编码器与密集 Transformer 解码器结合,是否能产生比现有方法更高分辨率的 CHMs?
- RQ3基于 GEDI 的重缩放校正是否能提升跨地点的 ALS 推断 CHMs 的准确性与泛化能力?
- RQ4在 NEON、CA-Brande 和 São Paulo 测试集上,拟议方法的定量精度(MAE、RMSE、R^2、ME)是多少?
- RQ5与 ~10 m–30 m 分辨率的现有全球地图相比,所提议的高分辨率 CHMs 有何表现?
主要发现
- 基于 SSL 的模型(在 1800 万张 Maxar 图像上训练)配合 DPT 解码器,在 NEON 和 CA-Brande 数据集上对冠层高度的精度优于 ResUNet 基线。
- 在 São Paulo,GEDI 校正步骤(SSL+GEDI)提供了最佳结果,表明在全球 GEDI 监督下具有更好的泛化性。
- 表 2 显示冠层高度指标,其中 SSL+GEDI 的 MAE 为 2.8 m、RMSE 为 4.5 m、R^2 为 0.63、ME 为 1.5 m,在跨数据集的平均值上优于多种场景的 ResUNet 基线。
- 与先前的全球 CHMs(Lang 等,2022a;Potapov 等,2021)相比,所生成的地图具有更高的分辨率(输入 ~0.59 m GSD,输出 1 m CHM),并在验证激光雷达方面显示出有竞争力的精度。
- 作者已将全分辨率数据集以云优化地理TIFF格式通过 AWS OpenData 与 Earth Engine 公开发布供公众访问。
- 该方法为加利福尼亚和圣保罗提供了可行的墙到墙 CHMs, enabling 更细粒度的碳映射与 FLR 监测。

更好的研究,从现在开始
从论文设计到论文写作,大幅缩短您的研究时间。
无需绑定信用卡
本解读由 AI 生成,并经人工编辑审核。