
[论文解读] Which model features matter? An experimental approach to evaluate power market modeling choices
本文评估了四种关键模型特征——模型类型(优化 vs. 模拟)、规划时间范围(跨期 vs. 短视)、时间分辨率(8760 小时 vs. 384 小时)和空间分辨率(28 个国家 vs. 12 个超大区域)——对欧洲至 2050 年电力市场建模结果的影响。基于统一的数据集和五个模型,研究发现模型类型和分辨率显著影响结果,尤其是风电部署和容量扩展,其中较低分辨率会高估储能能力并低估输电约束。
A novel experimental approach of inter- and intramodel comparisons is conducted with five power market models to give recommendations for modelers working on decarbonization pathways of Europe until 2050. The experiments investigate the impact of model type (optimization vs. simulation), planning horizon (intertemporal vs. myopic), temporal resolution (8760 vs. 384 hours), and spatial resolution (28 countries vs. 12 mega-regions). The model type fundamentally determines the evolution of capacity expansion. Planning horizon (assumed foresight of firms) plays a minor role for scenarios with high carbon prices. For low carbon prices in turn, results from myopic models deviate considerably from those of intertemporal models. Lower temporal and spatial resolutions foster wind power via storage and via neglected transmission boundaries, respectively. Using simulation instead of optimization frameworks, a shorter planning horizon of firms, or lower temporal and spatial resolutions might be necessary to reduce the computational complexity. This paper delivers recommendations on how to limit the discrepancies in such cases.
研究动机与目标
- 识别哪些模型特征——模型类型、规划时间范围、时间分辨率和空间分辨率——对欧洲脱碳电力市场建模结果影响最大。
- 通过在统一数据和情景条件下的模型间与模型内比较,减少模型结果之间的差异。
- 为建模者提供可操作的建议,以限制模型设计选择带来的非预期偏差。
- 通过公开共享统一的输入数据和模型输出,提升透明度并支持基准测试。
- 评估在不同模型构型下,尤其是高碳价与低碳价情景下,脱碳路径的稳健性。
提出的方法
- 使用五个不同的电力市场模型(DIMENSION、EUREGEN、E2M2、urbs、HECTOR)在欧盟27国+的统一数据集上开展模型间与模型内比较。
- 对输入数据、情景假设和模型特征进行标准化,以隔离四种关键模型设计选择(模型类型、规划时间范围、时间分辨率、空间分辨率)的影响。
- 执行一系列受控实验,每次仅改变一个特征而保持其他特征不变,以评估其对容量扩展、可再生能源部署和系统成本的独立影响。
- 采用一致的 2015–2050 时间范围,每 5 年为一个时间步长,并应用相同的碳价轨迹(高与低)、燃料价格和电力需求预测。
- 同时应用优化(利润最大化)和模拟(基于启发式)框架,以比较战略型与反应型企业行为。
- 通过 8760 小时和 384 个典型时间步长的表示方式评估时间分辨率,通过 28 个国家和 12 个超大区域分组方式评估空间分辨率。
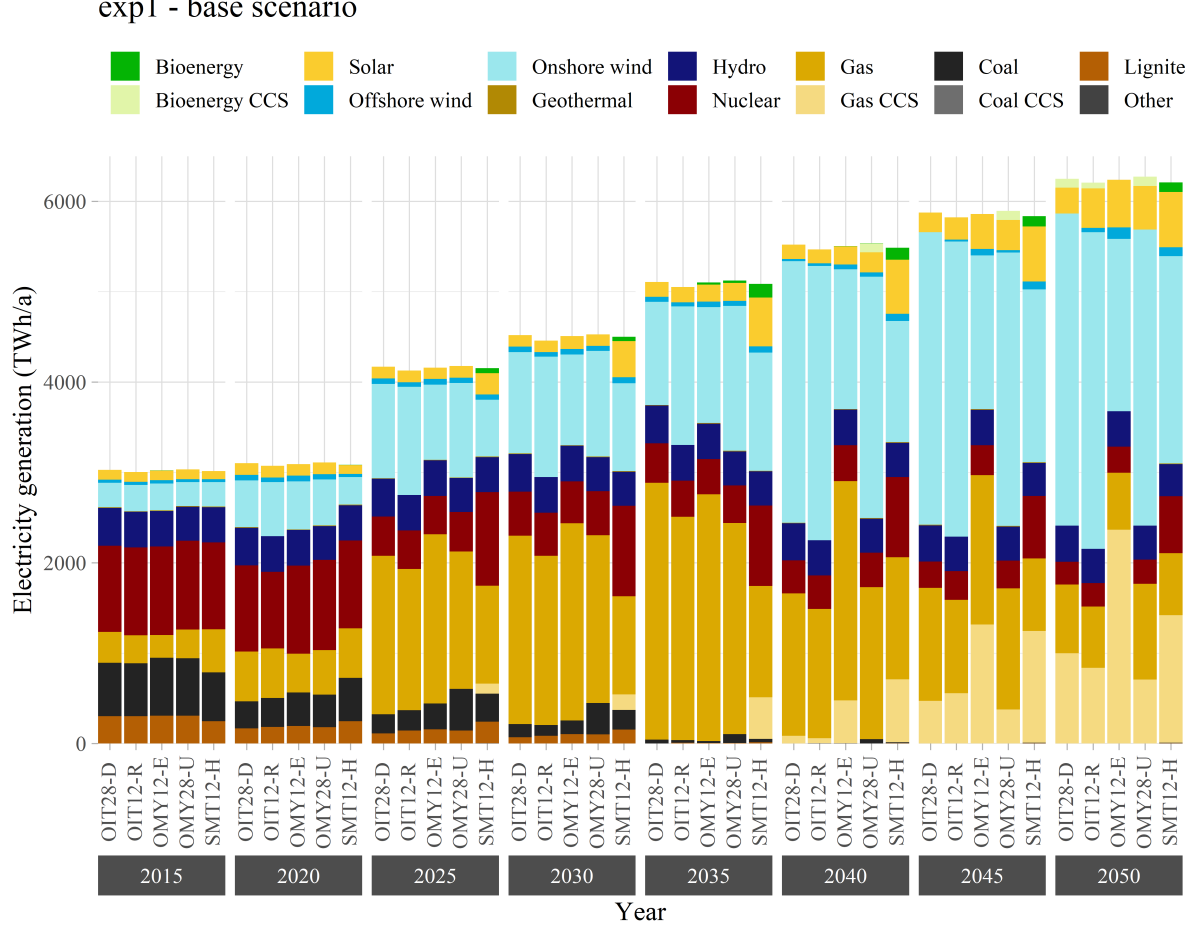
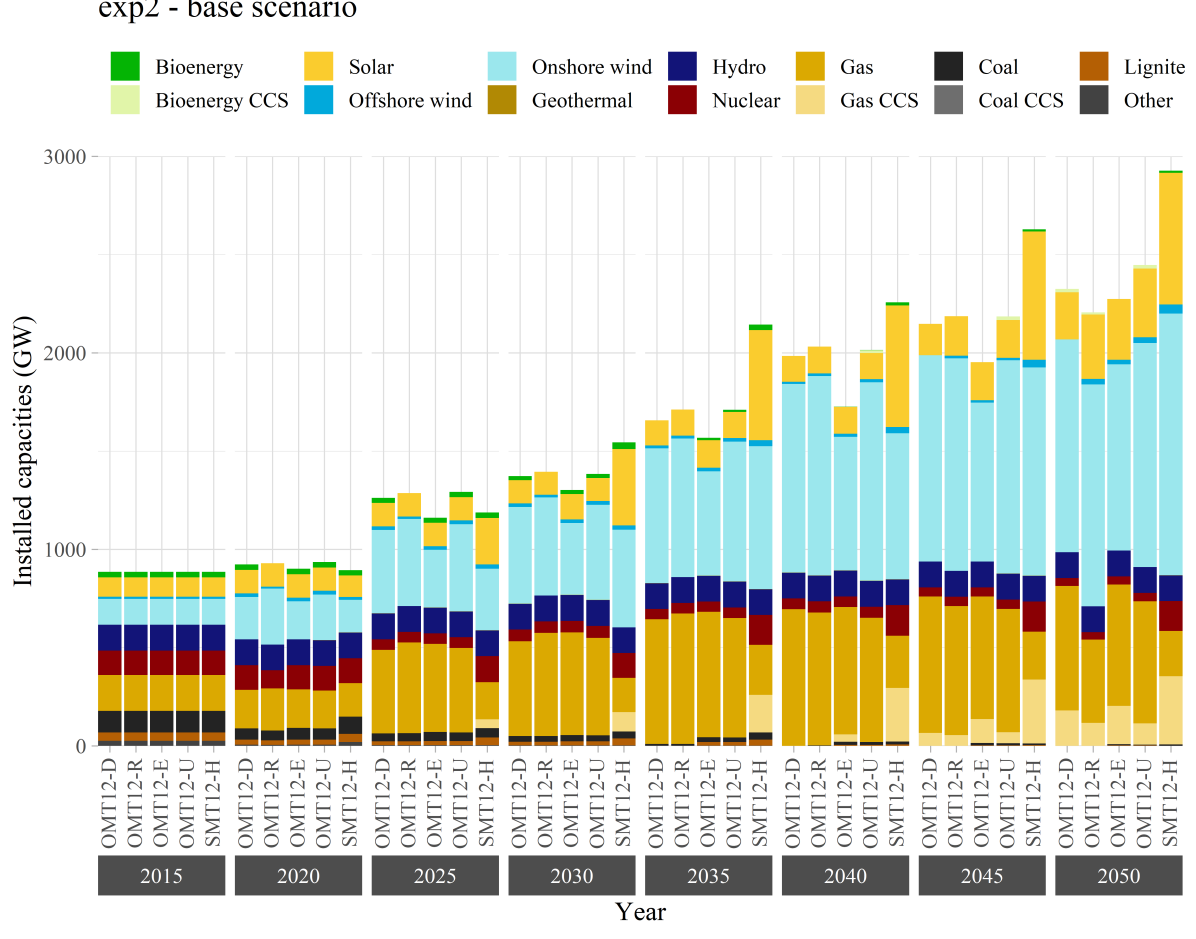
实验结果
研究问题
- RQ1在长期容量扩展和可再生能源部署方面,选择优化框架与模拟框架有何影响?
- RQ2在不同碳价水平下,跨期规划与短视规划在投资时序和技术组合方面有何影响?
- RQ3较低的时间分辨率和空间分辨率在多大程度上因高估储能能力和低估输电约束而扭曲风电部署?
- RQ4模型特征如何相互作用以塑造脱碳结果?哪些特征主导了结果的方差?
- RQ5通过标准化模型设计和数据统一化,能否系统性地减少模型输出之间的差异?
主要发现
- 模型类型从根本上决定了容量扩展路径:与优化模型相比,模拟模型对新技术的采纳更快,对传统发电厂(如煤电和核电)的淘汰更慢。
- 在 2050 年,短视模型与跨期模型在总可变可再生能源(VRE)部署方面表现相近,尽管跨期模型会推迟对高潜力 VRE 地区的投资。
- 较低的时间分辨率(384 个时间步长 vs. 8760 小时)导致风电部署被高估,原因在于波动性的非真实平滑化以及储能能力的过度估计。
- 较低的空间分辨率(12 个超大区域 vs. 28 个国家)导致风电部署更高,原因在于忽略了输电线路约束和跨国输电阻塞效应。
- 在低碳价情景下,短视模型与跨期模型在投资时序和能源组合方面存在显著差异;而在高碳价情景下,这种差异减小。
- 统一的数据集和模型输出已公开,以支持未来模型开发与验证中的基准测试和透明度。
更好的研究,从现在开始
从阅读论文到最终审阅,大幅缩短您的研究时间。
无需绑定信用卡
本解读由 AI 生成,并经人工编辑审核。