
QUICK REVIEW
[论文解读] DESI 2024 III: Baryon Acoustic Oscillations from Galaxies and Quasars
DESI Collaboration, A. G. Adame|arXiv (Cornell University)|Apr 3, 2024
Galaxies: Formation, Evolution, Phenomena被引用 66
一句话总结
DESI 2024 III 利用 DESI DR1 数据对星系和类星体进行 BAO 测量,在六个红移区间实现亚百分点的精度,并在所有区间揭示 BAO。
ABSTRACT
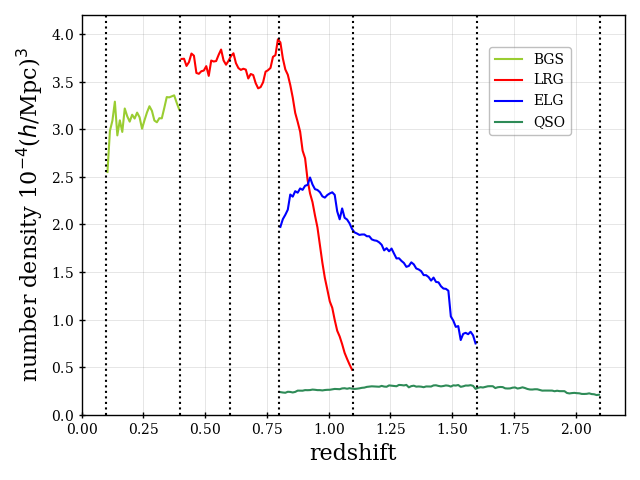
We present the DESI 2024 galaxy and quasar baryon acoustic oscillations (BAO) measurements using over 5.7 million unique galaxy and quasar redshifts in the range 0.1
研究动机与目标
- 在 DR1 中对多种 DESI 跟踪器(BGS、LRGs、ELGs、QSOs)在 0.1 < z < 2.1 的范围内测量 BAO 信号。
- 开发并验证跨跟踪器的统一 BAO 分析流程。
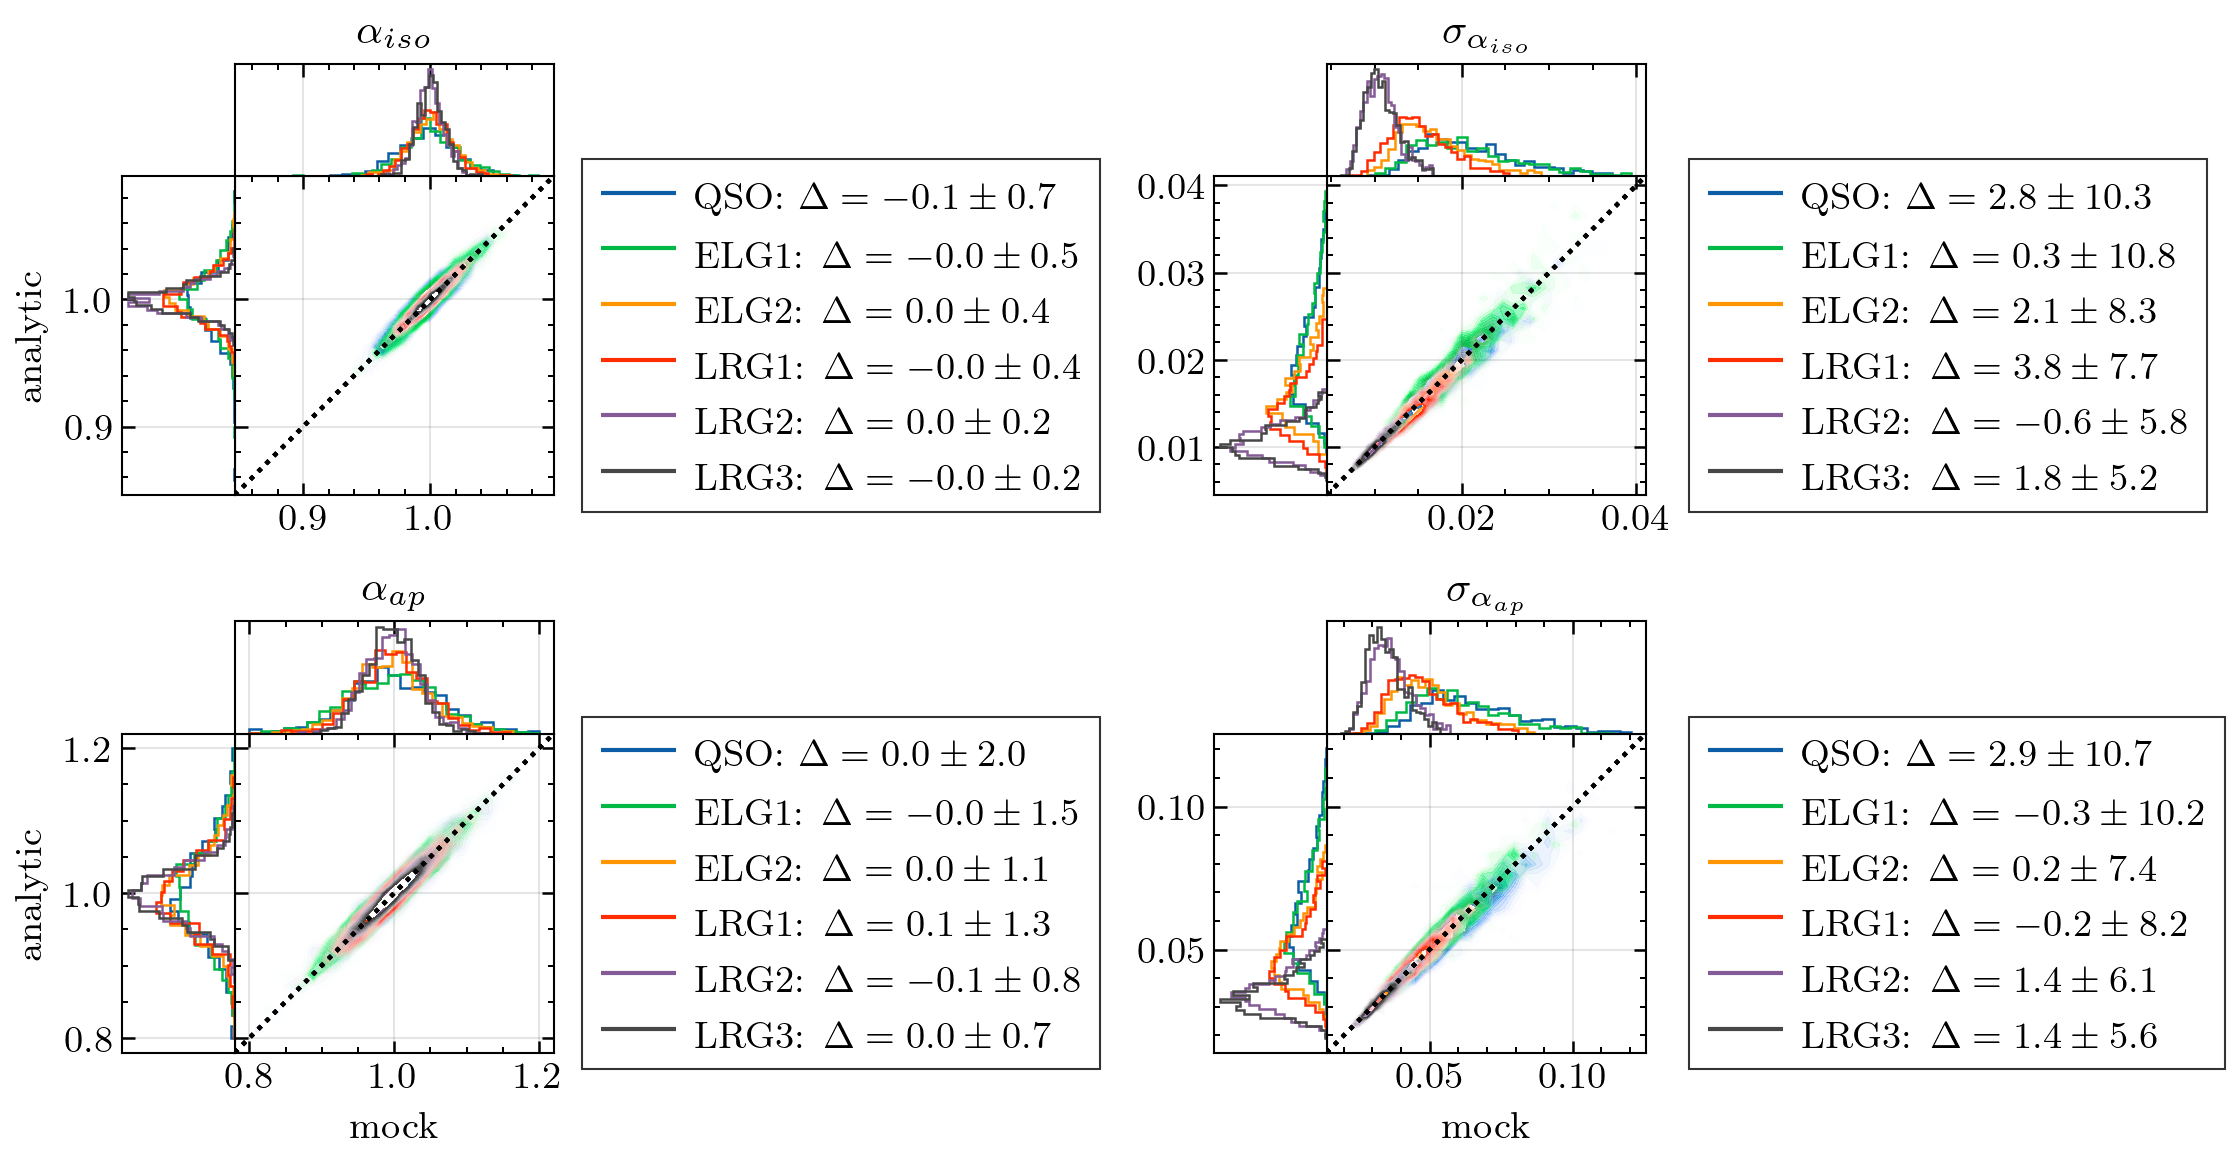
- 利用模拟和盲测目录量化系统误差,获得鲁棒的 BAO 距离约束。
- 使用改进的 DESI 方法对 SDSS BOSS/eBOSS 结果进行重新分析,以进行一致性检验。
- 在相关论文中给出距离量(D_A、H)以及对宇宙学含义的约束。
提出的方法
- 盲法目录级分析,以避免确认性偏差。
- 在所有跟踪器中进行统一的 BAO 拟合与重建。
- 使用 fiducial Planck 2018 的 LCDM 宇宙学模型进行距离测量。
- 构建具有跟踪器特定红移分区的大尺度结构目录。
- 使用解析与基于模拟的方法估计协方差矩阵。
- 纳入重建(RecSym)和波段边际化改进。
实验结果
研究问题
- RQ1在每个 DESI 跟踪器和红移区间中的 BAO 信号强度是多少?
- RQ2将 BAO 得到的距离量 D_A(z) 和 H(z) 进行组合时,如何约束膨胀历史?
- RQ3在 BAO 拟合、重建和协方差估计方面的改进如何影响测量的精度和鲁棒性?
- RQ4在新方法下,DESI DR1 的 BAO 结果是否与先前的 SDSS/BOSS/eBOSS 分析一致?
- RQ5DR1 BAO 测量的系统误差相对于统计不确定性有多大?
主要发现
- 在六个红移区间中实现了 BAO 的探测,最高的显著性为 9.1σ,z_eff ≈ 0.93。
- 总体有效观测体积约为 18 Gpc^3,BAO 总精度约为 0.52%,较前一年结果提升约 1.2 倍。
- 测得的 BAO 尺寸约束使 BAO 标度的精度达到 0.86%。
- 结果表明,在 z < 0.8 时测量值系统性地高于 Planck 2018 LCDM 的预测。
- 使用 DESI 方法重新分析 SDSS BOSS/eBOSS 数据,显示的散布与 SDSS 理论系统误差一致。
- 测量结果被转化为横向共动距离 D_A(z) 和径向 H(z),以在相关论文中约束宇宙模型。
更好的研究,从现在开始
从阅读论文到最终审阅,大幅缩短您的研究时间。
无需绑定信用卡
本解读由 AI 生成,并经人工编辑审核。