
[论文解读] Dry-to-Wet Soil Gradients Enhance Convection and Rainfall over Subtropical South America
本研究揭示,数十公里量级的干到湿土壤湿度(SM)梯度通过生成中尺度环流,在南亚热带地区增强对流和降雨。土壤湿度-降水(SM-PPT)反馈的符号关键取决于背景风速:弱风导致负反馈(降雨局限于干区),而强风则促进传播并产生正反馈(降雨下风向移动),凸显了对流尺度模型面临的关键挑战。
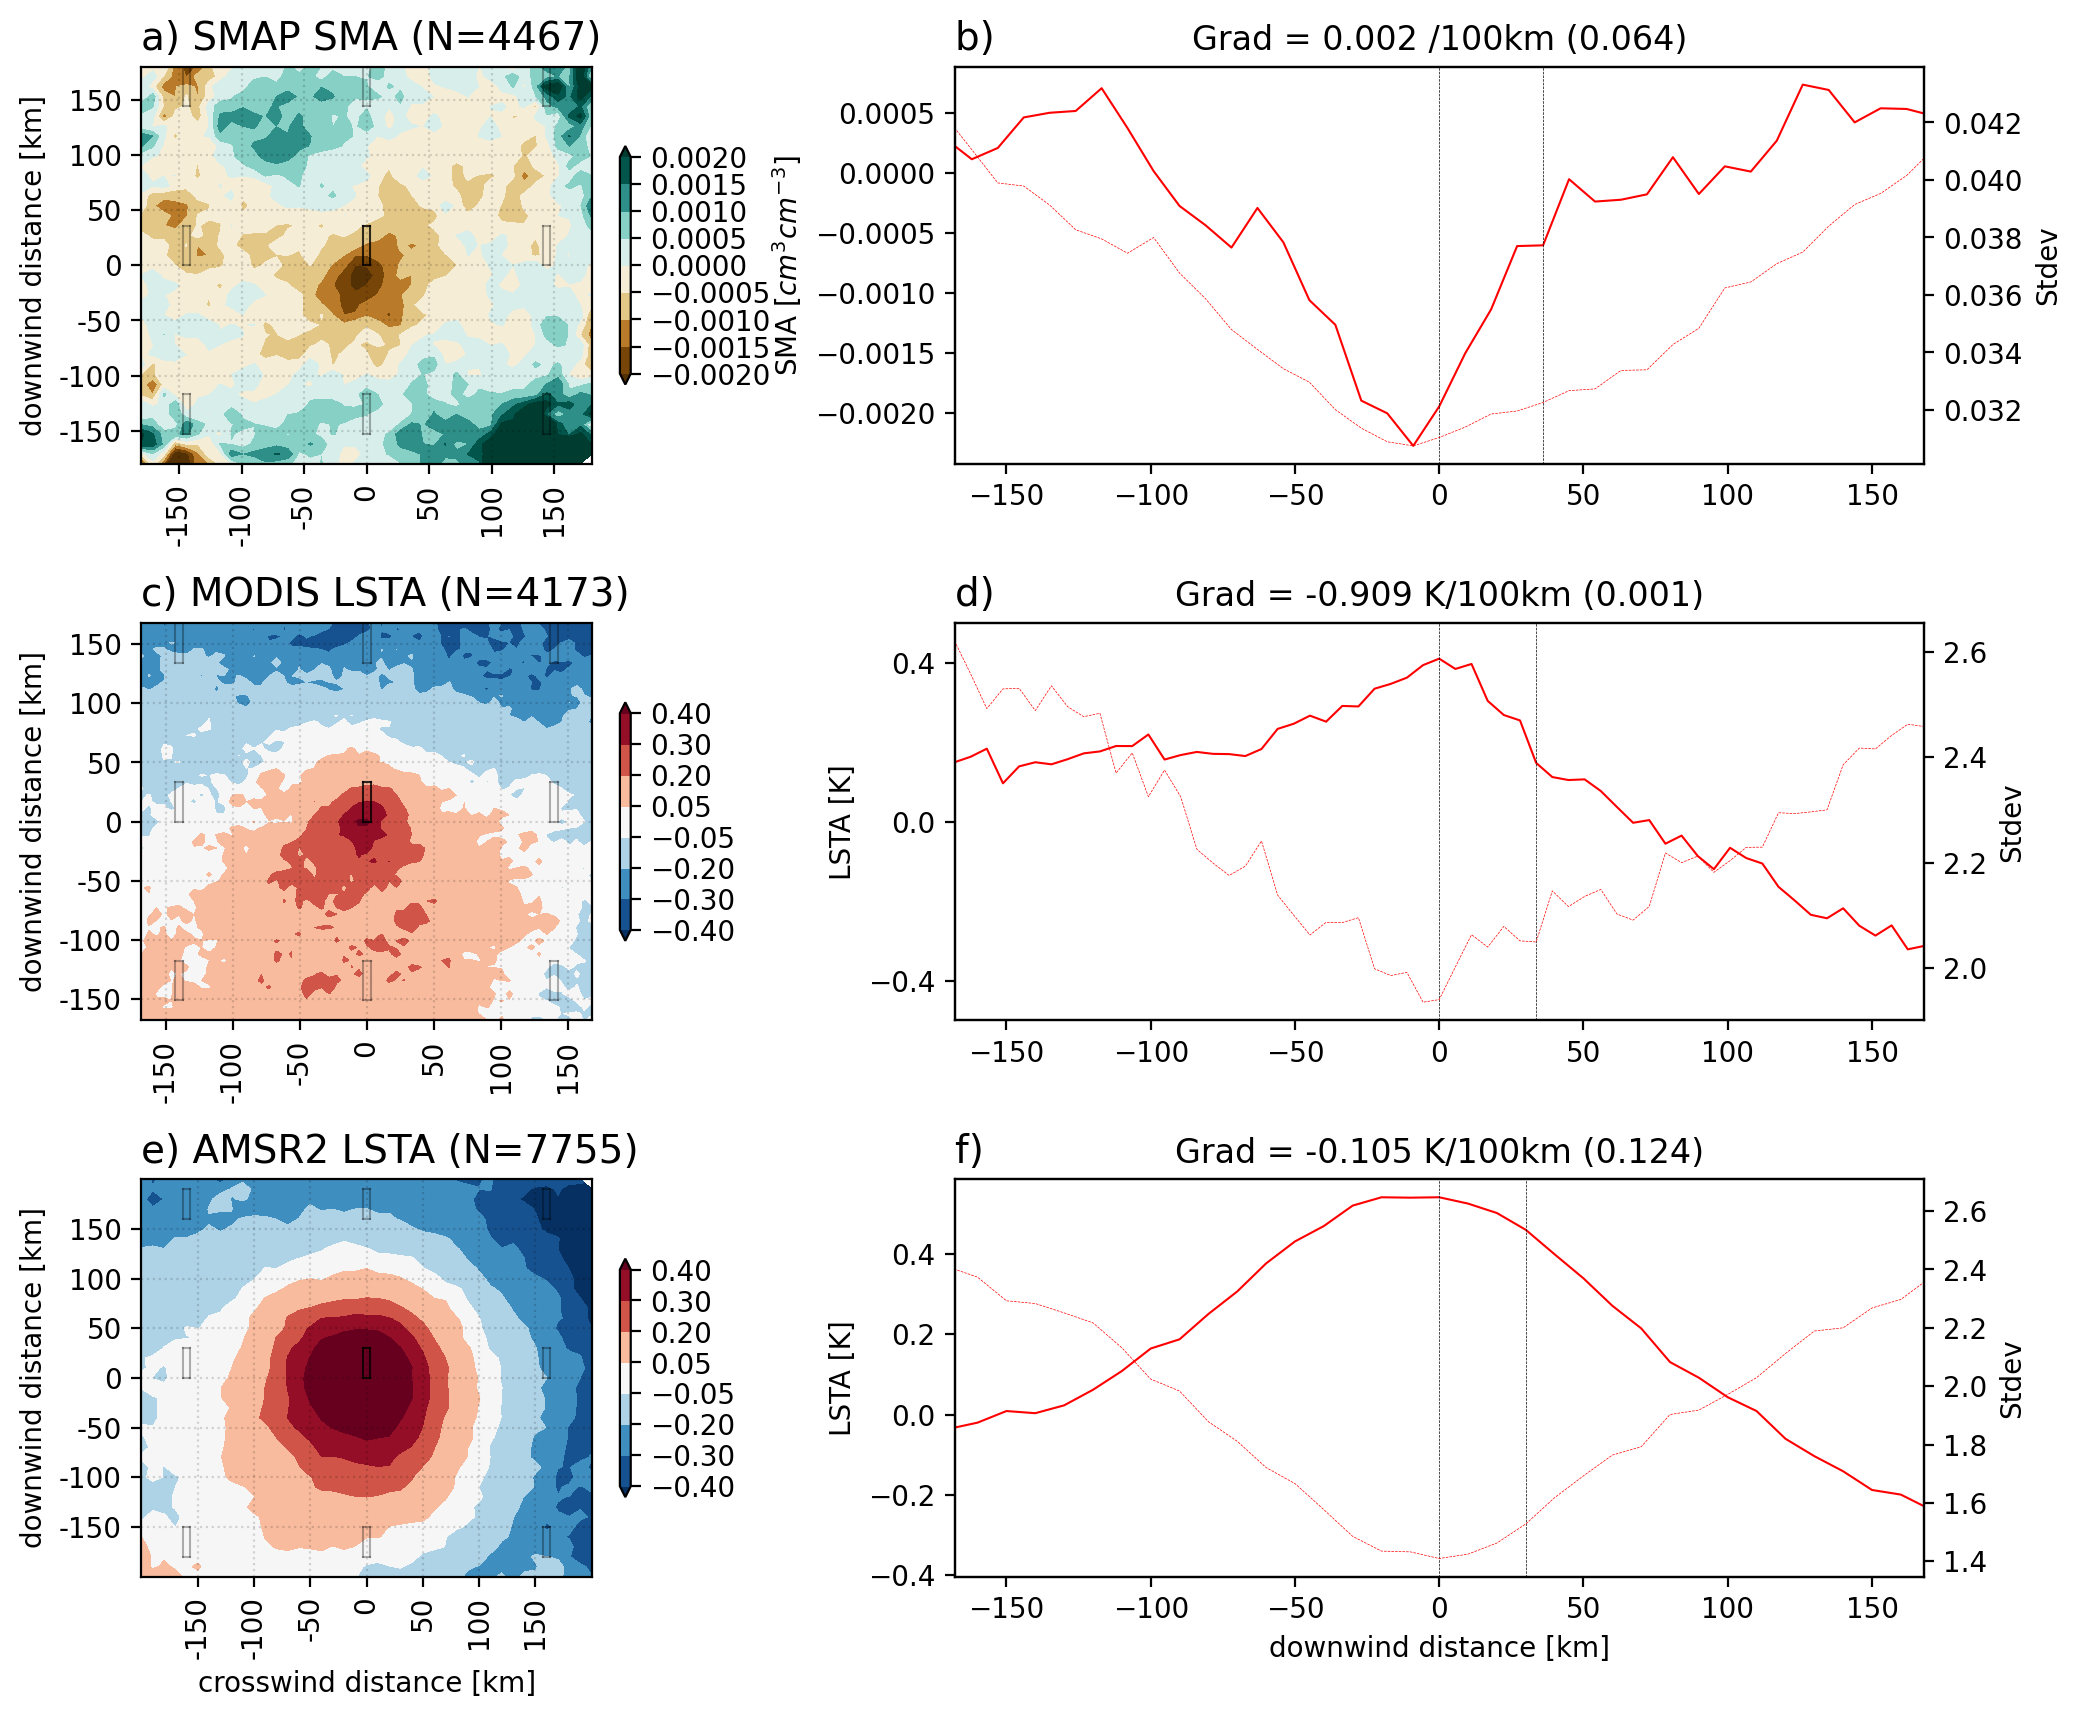
Soil moisture-precipitation (SM-PPT) feedbacks at the mesoscale represent a major challenge for numerical weather prediction, especially for subtropical regions that exhibit large variability in surface SM. How does surface heterogeneity, specifically mesoscale gradients in SM and land surface temperature (LST), affect convective initiation (CI) over South America? Using satellite data, we track nascent, daytime convective clouds and quantify the underlying antecedent (morning) surface heterogeneity. We find that convection initiates preferentially on the dry side of strong SM/LST boundaries with spatial scales of tens of kilometers. The strongest alongwind gradients in LST anomalies at 30 km length scale underlying the CI location occur during weak background low-level wind (<2.5m/s), high convective available potential energy (>1500J/kg) and low convective inhibition (<250J/kg) over sparse vegetation. At 100 km scale, strong gradients occur at the CI location during convectively unfavorable conditions and strong background flow. The location of PPT is strongly sensitive to the strength of the background flow. The wind profile during weak background flow inhibits propagation of convection away from the dry regions leading to negative SM-PPT feedback whereas strong background flow is related to longer lifecycle and rainfall hundreds of kilometers away from the CI location. Thus, the sign of the SM-PPT feedback is dependent on the background flow. This work presents the first observational evidence that CI over subtropical South America is associated with dry soil patches on the order of tens of kilometers. Convection-permitting numerical weather prediction models need to be examined for accurately capturing the effect of SM heterogeneity in initiating convection over such semi-arid regions.
研究动机与目标
- 理解南亚热带地区中尺度土壤湿度(SM)和地表温度(LST)异质性如何影响对流触发(CI)。
- 量化背景风、对流可用位能(CAPE)和对流抑制能(CIN)在对流尺度上调节SM-PPT反馈的作用。
- 评估SM/LST梯度空间尺度(30 km 与 100 km)对对流和降雨的影响敏感性。
- 评估植被覆盖和地形对异质地表中尺度环流及CI的影响。
- 为SM-PPT反馈符号依赖于背景气流提供观测证据,这对改进对流允许模型至关重要。
提出的方法
- 利用卫星数据追踪白天初生对流云,以识别南亚热带地区对流触发(CI)的位置。
- 使用30 km和100 km空间尺度分析前一日早晨的地表异质性,包括SM和LST异常。
- 利用多源卫星数据集:GPM-IMERG用于降水,SMAP用于微波SM,MODIS和AMSR2用于LST,ERA5用于风、CAPE和CIN。
- 计算LST异常的下风向梯度,并评估其与CI发生概率的相关性,条件为不同背景风速。
- 将条件分类为弱风(≤2.5 m/s)和强风(>2.5 m/s)背景风场,以评估反馈符号。
- 绘制CI后24小时内降水量异常,以评估传播性和反馈强度。

实验结果
研究问题
- RQ1在南亚热带地区,对流是否优先在较湿区域邻近的干燥土壤斑块上触发?
- RQ230 km与100 km尺度的SM/LST梯度如何影响中尺度环流和CI发生的可能性?
- RQ3背景风速在决定SM-PPT反馈符号方面起什么作用?
- RQ4植被覆盖和地形如何调节SM异质性触发对流的有效性?
- RQ5对流从干燥区域向湿润区域的传播在多大程度上改变了降雨的空间分布和反馈符号?
主要发现
- 对流优先在强SM/LST梯度的干燥一侧触发,尤其在弱背景风(<2.5 m/s)和30 km空间尺度下。
- 最强的下风向LST梯度(30 km尺度)出现在高CAPE(>1500 J/kg)和低CIN(<250 J/kg)条件下,有利于稀疏植被区域的CI。
- 在100 km尺度下,即使在强背景风(>2.5 m/s)条件下,强梯度仍可通过生成中尺度环流来触发对流,从而克服湍流混合效应。
- 在复杂地形中,100 km尺度的SM不均匀性可引发坡上升流,增强安第斯山脉东部和巴西高原地区的对流,与下沉风相反。
- 在弱背景风条件下,对流被锚定在干燥斑块上,导致SM-PPT反馈为负(降雨落在干燥土壤上)。
- 在强背景风条件下,对流系统可向下游传播数百公里,导致SM-PPT反馈为正,降雨远超CI发生位置。
更好的研究,从现在开始
从阅读论文到最终审阅,大幅缩短您的研究时间。
无需绑定信用卡
本解读由 AI 生成,并经人工编辑审核。