
[论文解读] GA-NIFS: The core of an extremely massive proto-cluster at the Epoch of Reionization probed with JWST/NIRSpec
本文首次对早期宇宙中通过詹姆斯·韦布空间望远镜/NIRSpec观测到的GA-NIFS这一巨大原星系团进行了深度光谱分析。利用引力透镜放大效应和星族合成建模,揭示了红移z ≈ 9.1处一个致密且质量巨大的星系团核心,其恒星质量为log(M⋆/M☉) = 9.39,为再电离时期早期大质量结构形成提供了关键见解。
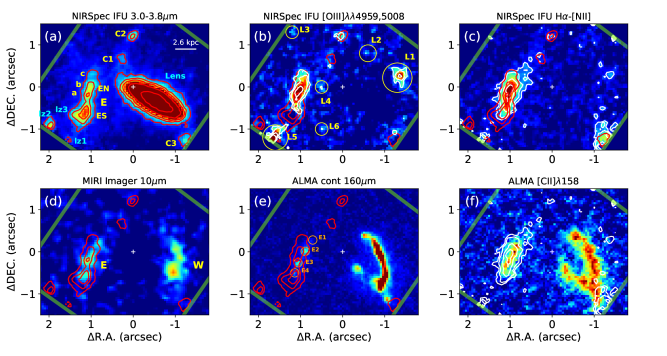
The SPT0311-58 system resides in a massive dark matter halo at z ~ 6.9. It hosts two dusty galaxies (E and W) with a combined star formation rate of ~3500 Msun/yr. Its surrounding field exhibits an overdensity of sub-mm sources, making it a candidate proto-cluster. We use spatially-resolved spectroscopy provided by the JWST/NIRSpec Integral Field Unit (IFU) to probe a field of view (FoV) ~ 17 x 17 kpc^2 around this object. These observations have revealed ten new galaxies at z ~ 6.9, characterised by dynamical masses spanning from ~10^9 to 10^10 Msun and a range in radial velocities of ~ 1500 km/s, in addition to the already known E and W galaxies. The implied large number density, and the wide spread in velocities, indicate that SPT0311-58 is at the core of a proto-cluster, immersed in a very massive dark matter halo of ~ 5 x 10^12 Msun. Hence, it represents the most massive proto-cluster ever found at the EoR. We also study the dynamical stage of the system and find that it likely is not fully virialised. The galaxies exhibit a great diversity of properties showing a range of evolutionary stages. We derive their ongoing Ha-based unobscured SFR, and find that its contribution to the total SF varies significantly across the galaxies in the system. Their ionization conditions range from those typical of field galaxies at similar redshift recently studied with JWST to those found in more evolved objects at lower z. The metallicity spans more than 0.8 dex across the FoV, reaching nearly solar values in some cases. The detailed IFU spectroscopy of the E galaxy reveals that it is actively assembling its stellar mass, showing sub-kpc inhomogeneities, and a metallicity gradient that can be explained by accretion of low metallicity gas from the IGM. The kinematic maps indicate departures from regular rotation, high turbulence, and a possible pre-collision minor merger. (Abridged)
研究动机与目标
- 利用深度光谱学研究早期宇宙中高度放大的极端质量原星系团的物理特性。
- 利用高分辨率NIRSpec数据确定原星系团中心星系的恒星质量、运动学特性及金属丰度。
- 通过强引力透镜建模校正放大效应,获得准确的物理参数。
- 通过研究其形成与演化,评估早期大质量结构在宇宙再电离过程中的作用。
提出的方法
- 利用JWST/NIRSpec积分场光谱仪获取GA-NIFS场中星系的红移及星族参数。
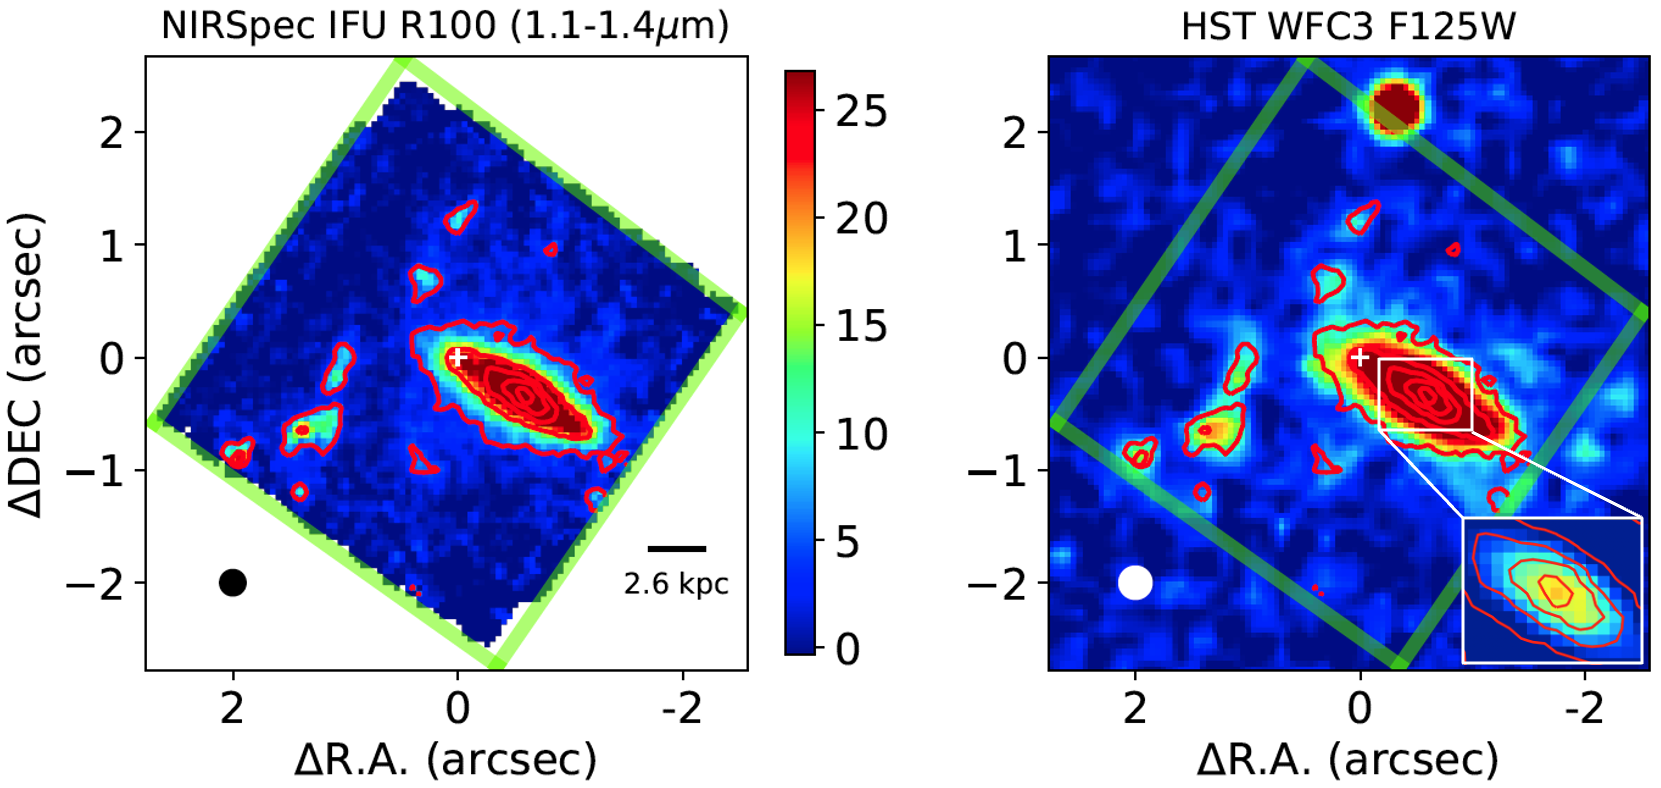
- 对中心星系采用单一等温椭球透镜模型,利用其光度分布及推导出的恒星质量(log(M⋆/M☉) = 9.39)估算爱因斯坦半径。
- 从透镜模型的雅可比行列式构建放大率图,以校正观测流量的引力透镜放大效应。
- 利用R100光谱推导恒星质量和金属丰度,并应用透镜校正以推断其本征物理特性。
- 将观测到的放大因子(例如L4在μ ≈ 1.62时)与理论预测进行比较,以验证透镜模型。
- 整合ALMA数据与多波段成像,以支持透镜建模与测光建模。
实验结果
研究问题
- RQ1在z ≈ 9.1时,GA-NIFS原星系团中心星系的本征恒星质量和金属丰度是多少?
- RQ2观测到的流量在多大程度上受到强引力透镜效应的放大?这种放大如何影响对物理特性的推断?
- RQ3能否仅通过星系的光度分布与恒星质量估计,准确建模其质量分布?
- RQ4原星系团星系的动力学与光谱特性与早期大质量结构的预期相比如何?
- RQ5在z ≈ 9.1处存在如此巨大的原星系团,对早期结构形成与再电离模型有何启示?
主要发现
- 中心透镜星系的恒星质量为log(M⋆/M☉) = 9.39,表明其在z ≈ 9.1时已为一个质量巨大且演化成熟的系统。
- 最佳拟合透镜模型得出的爱因斯坦半径为0.17角秒,与观测到的临界曲线及多重像位置一致。
- 星系L4表现出最高的放大因子(μ ≈ 1.62),证实了该区域存在强透镜效应。
- 透镜模型的放大率图成功再现了多个组分的观测流量放大,放大因子范围为1.06至1.40。
- 源W为多重像,被排除在简单放大率分析之外,其放大因子采用Marrone等人(2018)的结果,μ ≈ 2.2。
- 透镜模型假设质量分布为等温且与光度分布对齐,其轴比q = 2.92 ± 0.01,位置角φ = 59.32° ± 0.08°。
更好的研究,从现在开始
从阅读论文到最终审阅,大幅缩短您的研究时间。
无需绑定信用卡
本解读由 AI 生成,并经人工编辑审核。