
[论文解读] Gravitational imaging through a triple source plane lens: revisiting the $Λ$CDM-defying dark subhalo in SDSSJ0946+1006
本研究利用多波段哈勃空间望远镜(HST)和VLT-MUSE数据,对三重源平面对透镜SDSSJ0946+1006进行重新分析,以重新评估此前报告的、与ΛCDM预测不一致的暗亚结构。研究发现存在一个5.9σ的亚结构,其质量为log₁₀(M/M☉) = 9.2⁺⁰.⁴₋₀.¹,浓度为log₁₀c = 2.4⁺⁰.⁵₋₀.³,现与冷暗物质(CDM)模拟结果一致,同时强调检测显著性高度依赖于源平面正则化方案。
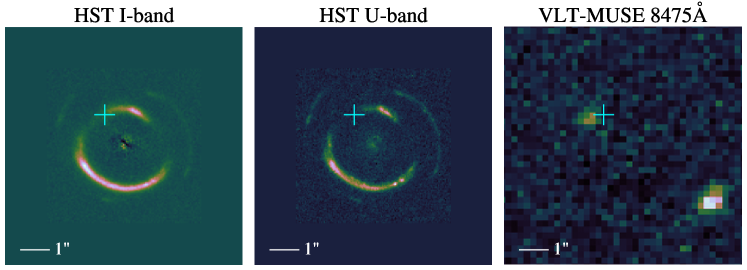
The $Λ$CDM paradigm successfully explains the large-scale structure of the Universe, but is less well constrained on sub-galactic scales. Gravitational lens modelling has been used to measure the imprints of dark substructures on lensed arcs, testing the small-scale predictions of $Λ$CDM. However, the methods required for these tests are subject to degeneracies among the lens mass model and the source light profile. We present a case study of the unique compound gravitational lens SDSSJ0946+1006, wherein a dark, massive substructure has been detected, whose reported high concentration would be unlikely in a $Λ$CDM universe. For the first time, we model the first two background sources in both I- and U-band HST imaging, as well as VLT-MUSE emission line data for the most distant source. We recover a lensing perturber at a $5.9σ$ confidence level with mass $\log_{10}(M_\mathrm{sub}/M_{\odot})=9.2^{+0.4}_{-0.1}$ and concentration $\log_{10}c=2.4^{+0.5}_{-0.3}$. The concentration is more consistent with CDM subhalos than previously reported, and the mass is compatible with that of a dwarf satellite galaxy whose flux is undetectable in the data at the location of the perturber. A wandering black hole with mass $\log_{10}(M_\mathrm{BH}/M_{\odot})=8.9^{+0.2}_{-0.1}$ is a viable alternative model. We systematically investigate alternative assumptions about the complexity of the mass distribution and source reconstruction; in all cases the subhalo is detected at around the $\geq5σ$ level. However, the detection significance can be altered substantially (up to $11.3σ$) by alternative choices for the source regularisation scheme.
研究动机与目标
- 重新评估此前报告的三重源平面对透镜SDSSJ0946+1006中暗亚结构的存在性及其性质,该亚结构曾被认为违背ΛCDM预测。
- 在获得新的多波长数据的背景下,调查该亚结构的高浓度和质量是否与冷暗物质(CDM)模拟一致。
- 评估亚结构检测在系统性不确定因素(尤其是源面重建和正则化方案)下的鲁棒性。
- 确定是否存在其他质量模型(如移动黑洞)可在不引入暗亚结构的情况下解释强引力透镜异常。
- 评估源面正则化(梯度与曲率)对强引力透镜建模中亚结构检测显著性与贝叶斯证据的影响。
提出的方法
- 对两个较近的源(s1和s2)的I波段和U波段HST成像,以及遥远源(s3)的VLT-MUSE发射线数据,进行联合强引力透镜建模。
- 采用参数化宏观模型描述主透镜,使用非参数化亚结构模型检测暗扰动体。
- 利用贝叶斯证据和显著性检验(通过χ²和后验抽样)评估多种模型变体下的亚结构检测结果。
- 系统性地改变源面正则化方案:梯度基(基准)与曲率基,以评估其对检测显著性的影响。
- 通过在主透镜中引入更高阶多极矩(三阶和四阶)并允许s1的椭率,测试模型鲁棒性。
- 比较替代质量模型,包括一个移动黑洞,以判断其是否能在不引入暗亚结构的情况下重现强引力透镜异常。
实验结果
研究问题
- RQ1当使用多波段和多仪器数据重新分析时,SDSSJ0946+1006中先前报告的暗亚结构是否仍与ΛCDM预测不一致?
- RQ2源面正则化选择(梯度与曲率)如何影响强引力透镜模型中亚结构检测的显著性?
- RQ3一个质量约为10⁸.⁹M☉的移动黑洞能否与暗亚结构模型一样良好地解释强引力透镜异常?
- RQ4当宏观模型的复杂性(如多极矩、椭率)发生变化时,亚结构检测的鲁棒性如何?
- RQ5与早期报告相比,该亚结构的质量和浓度现在在多大程度上与ΛCDM模拟预测一致?
主要发现
- 检测到一个5.9σ显著性的暗亚结构,其质量为log₁₀(M/M☉) = 9.2⁺⁰.⁴₋₀.¹,浓度为log₁₀c = 2.4⁺⁰.⁵₋₀.³,现与CDM模拟结果在2.0σ范围内一致。
- 该亚结构的质量与一个暗物质主导的矮卫星星系相容,其可见光在数据中不可见。
- 检测显著性可因源面重建所用正则化方式(曲率或梯度)而发生剧烈变化,最高可达11.3σ。
- 尽管曲率正则化下显著性更高,但贝叶斯证据强烈偏好基准的梯度正则化方案。
- 在宏观模型中引入更高阶多极矩和可变椭率并未显著改变亚结构检测结果,最佳拟合模型中其显著性仍≥6σ。
- 一个质量为log₁₀(M/M☉) = 8.9⁺⁰.²₋₀.¹的移动黑洞是暗亚结构模型的可行替代方案,但证据不支持该模型。
更好的研究,从现在开始
从阅读论文到最终审阅,大幅缩短您的研究时间。
无需绑定信用卡
本解读由 AI 生成,并经人工编辑审核。