
[论文解读] Mapping county-level mobility pattern changes in the United States in response to COVID-19
该论文提出一个交互式网络门户,利用聚合的智能手机数据在COVID-19期间跟踪美国县级移动性变化,以测量中位旅行距离和在家停留时间。它分析在居家令前后、期间的模式。
To contain the Coronavirus disease (COVID-19) pandemic, one of the non-pharmacological epidemic control measures in response to the COVID-19 outbreak is reducing the transmission rate of SARS-COV-2 in the population through (physical) social distancing. An interactive web-based mapping platform that provides timely quantitative information on how people in different counties and states reacted to the social distancing guidelines was developed with the support of the National Science Foundation (NSF). It integrates geographic information systems (GIS) and daily updated human mobility statistical patterns derived from large-scale anonymized and aggregated smartphone location big data at the county-level in the United States, and aims to increase risk awareness of the public, support governmental decision-making, and help enhance community responses to the COVID-19 outbreak.
研究动机与目标
- 提供及时的、县级定量移动性指标,以反映对COVID-19的社会疏离响应。
- 将地理信息系统与每日更新的移动性数据整合,以支持公共卫生决策。
- 评估在三个时期内的移动性变化:命令前、居家令期间和重新开放。
提出的方法
- 使用Descartes Labs移动性数据计算每个县的日最大距离移动,并从2020年2月17日至3月7日的工作日中推导基线。
- 将Region内所有样本日最大距离的中位数计算为Median Travel Distance。
- 相对于基线计算移动性的百分比变化。
- 使用SafeGraph社交疏离指标得出每个县的中位在家停留时间。
- 通过家庭位置和Geohash-7颗粒度将设备级数据聚合到县级,然后在ArcGIS Online中生成网页地图和时间序列项。
- 将仪表板设计为三层:数据/特征、方法论和应用,并使用ArcGIS Dashboards和Experience Builder部署。
实验结果
研究问题
- RQ1在州级居家命令的响应下,县级移动性模式有何变化?
- RQ2全美范围内在遵守社交疏离方面存在何种地理异质性?
- RQ3在部分重新开放期间,移动性如何反弹,哪些因素与这些变化相关?
- RQ4在家停留时间与各州区域感染动态之间的关系是什么?
主要发现
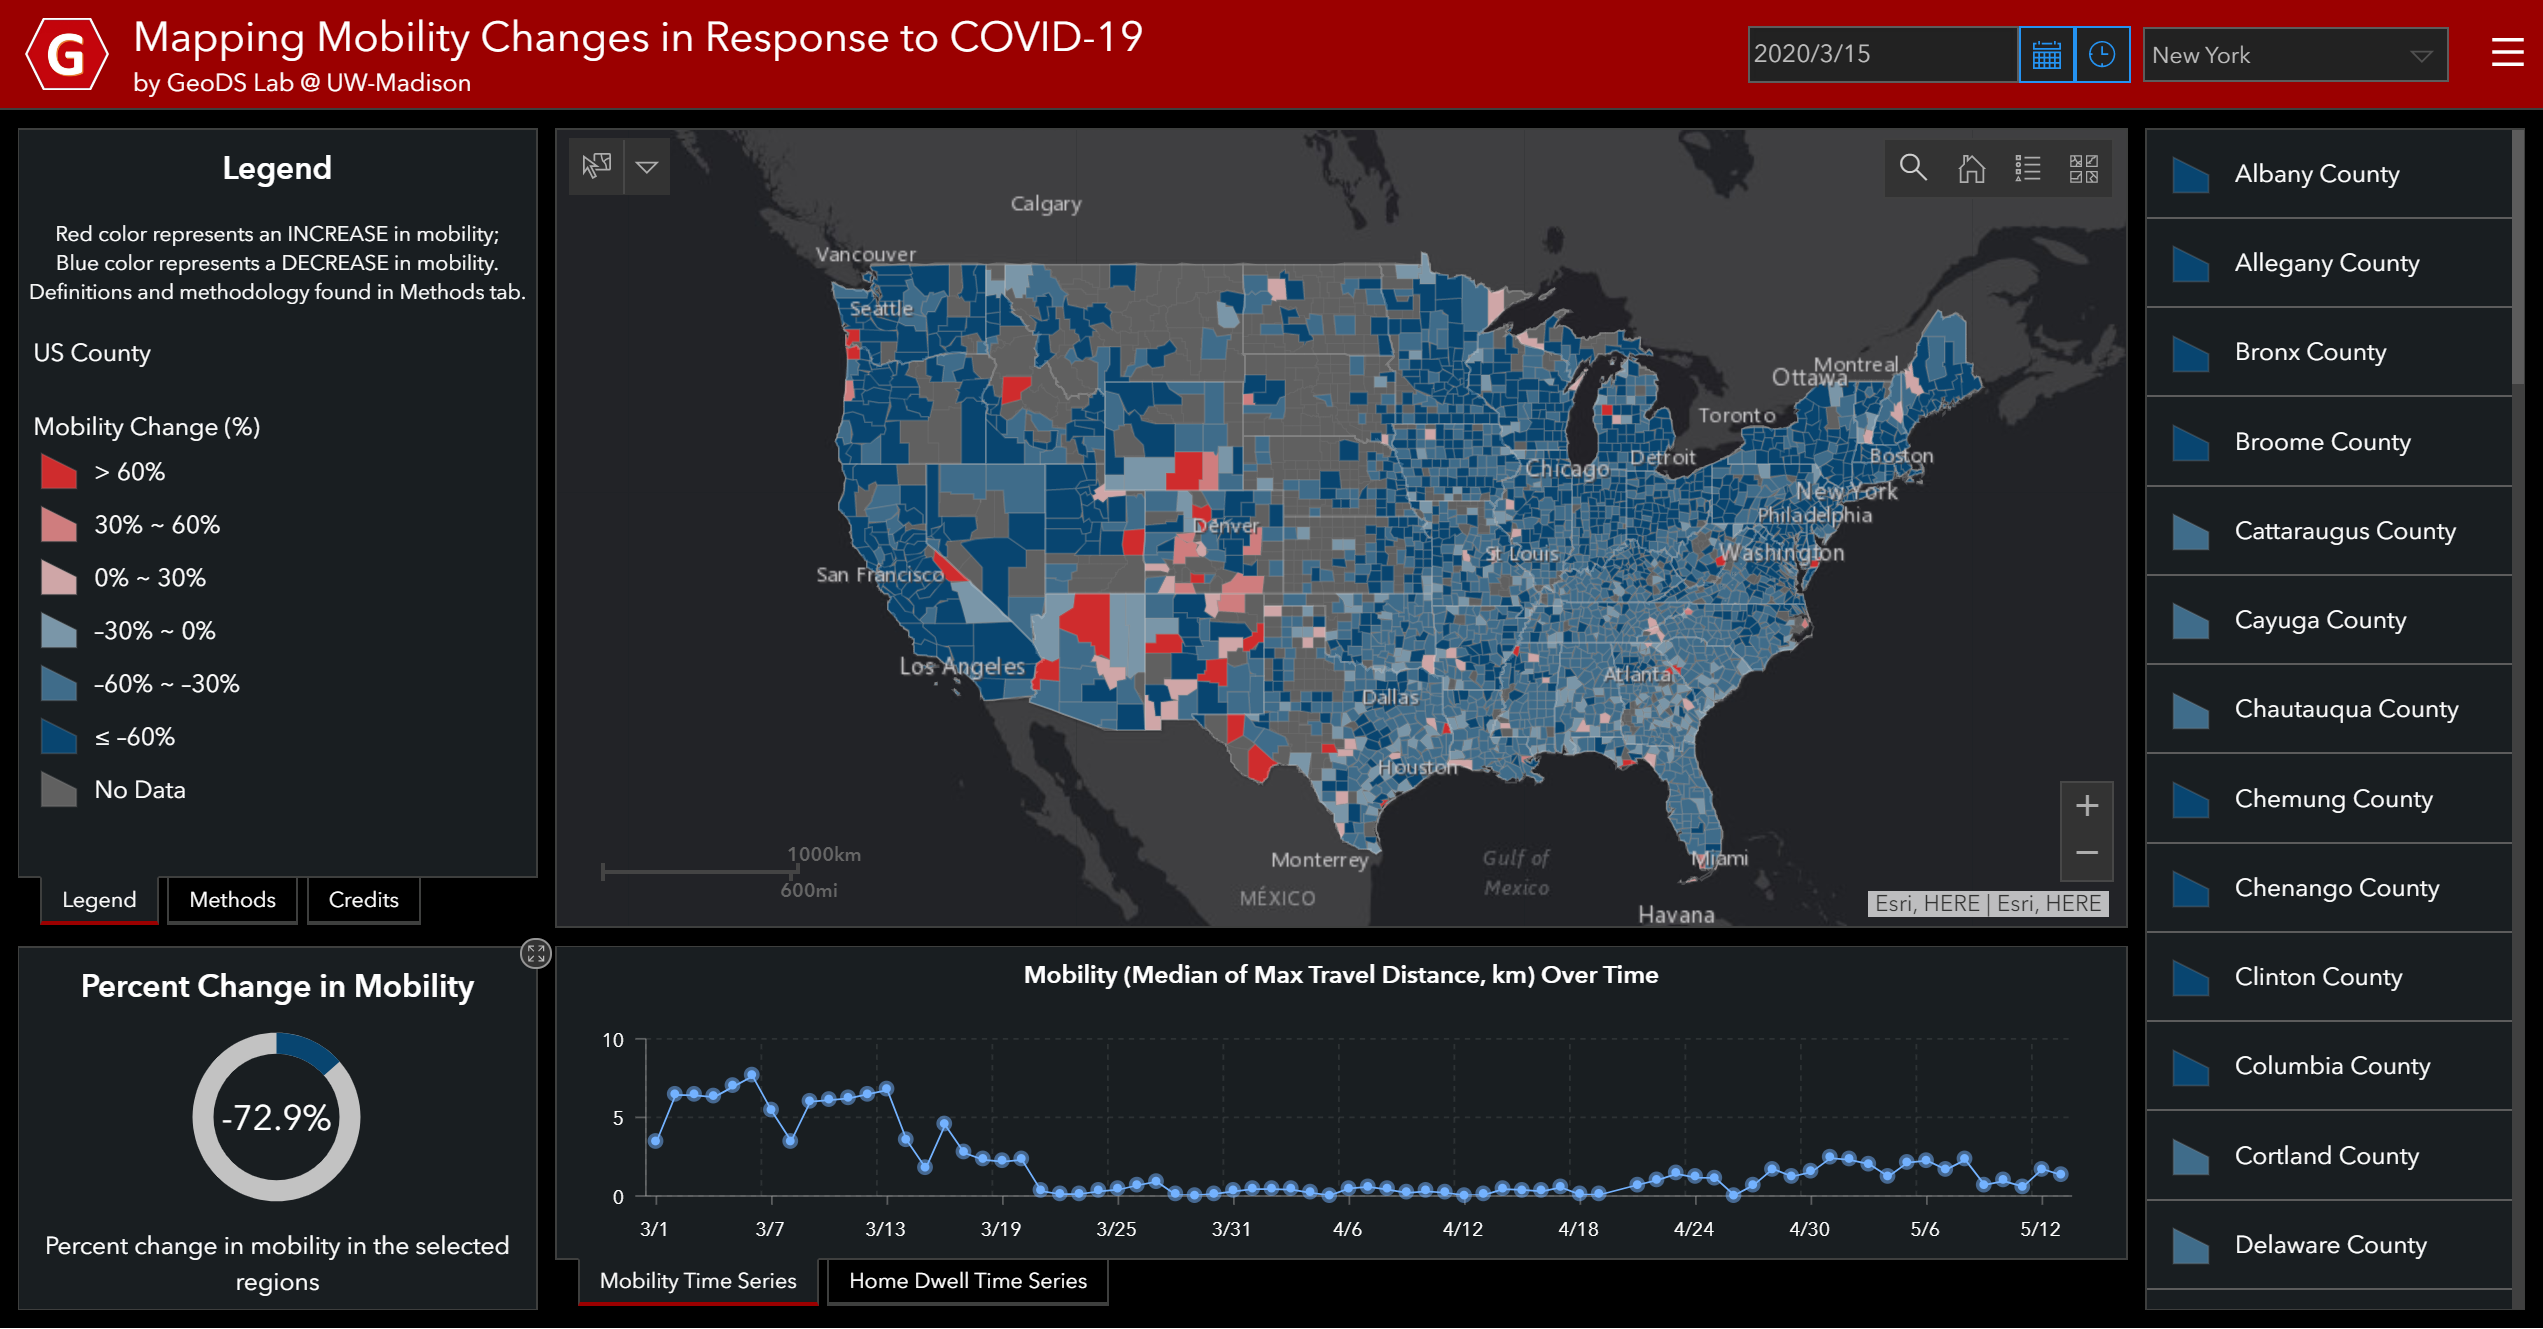
- 移动性变化具有地理异质性,在居家令后普遍减少(蓝色县),也有一些县出现移动增加(红色县)。
- 在像纽约这样的地区,中位旅行距离显著下降,居家高度遵守(例如,部分县降至接近0.1公里),并在各县之间存在差异。
- 五月初重新开放后,移动性再次开始上升,反映出旅行距离的反弹。
- 三日移动平均显示,在感染最高的州中,在家停留时间高于感染最低的州。
- 该平台使移动性模式识别、监测、建模和对公共卫生干预的决策支持成为可能。
- 研究指出,移动性下降并不能保证如CDC所定义的物理距离,强调数据局限性和隐私考量。
更好的研究,从现在开始
从阅读论文到最终审阅,大幅缩短您的研究时间。
无需绑定信用卡
本解读由 AI 生成,并经人工编辑审核。