
[论文解读] Spatial-temporal Analysis of COVID-19's Impact on Human Mobility: the Case of the United States
本研究利用苹果出行数据与谷歌趋势数据,分析了新冠疫情对美国人口流动的时空影响。研究发现,公众意识(通过搜索趋势衡量)与出行变化之间存在14天的延迟;按地理邻近性对州进行聚类;并显示到2020年4月中旬,网络中心性指标显著下降——度(−7.7%)、接近度(−6.9%)和中介性(−21.6%)。
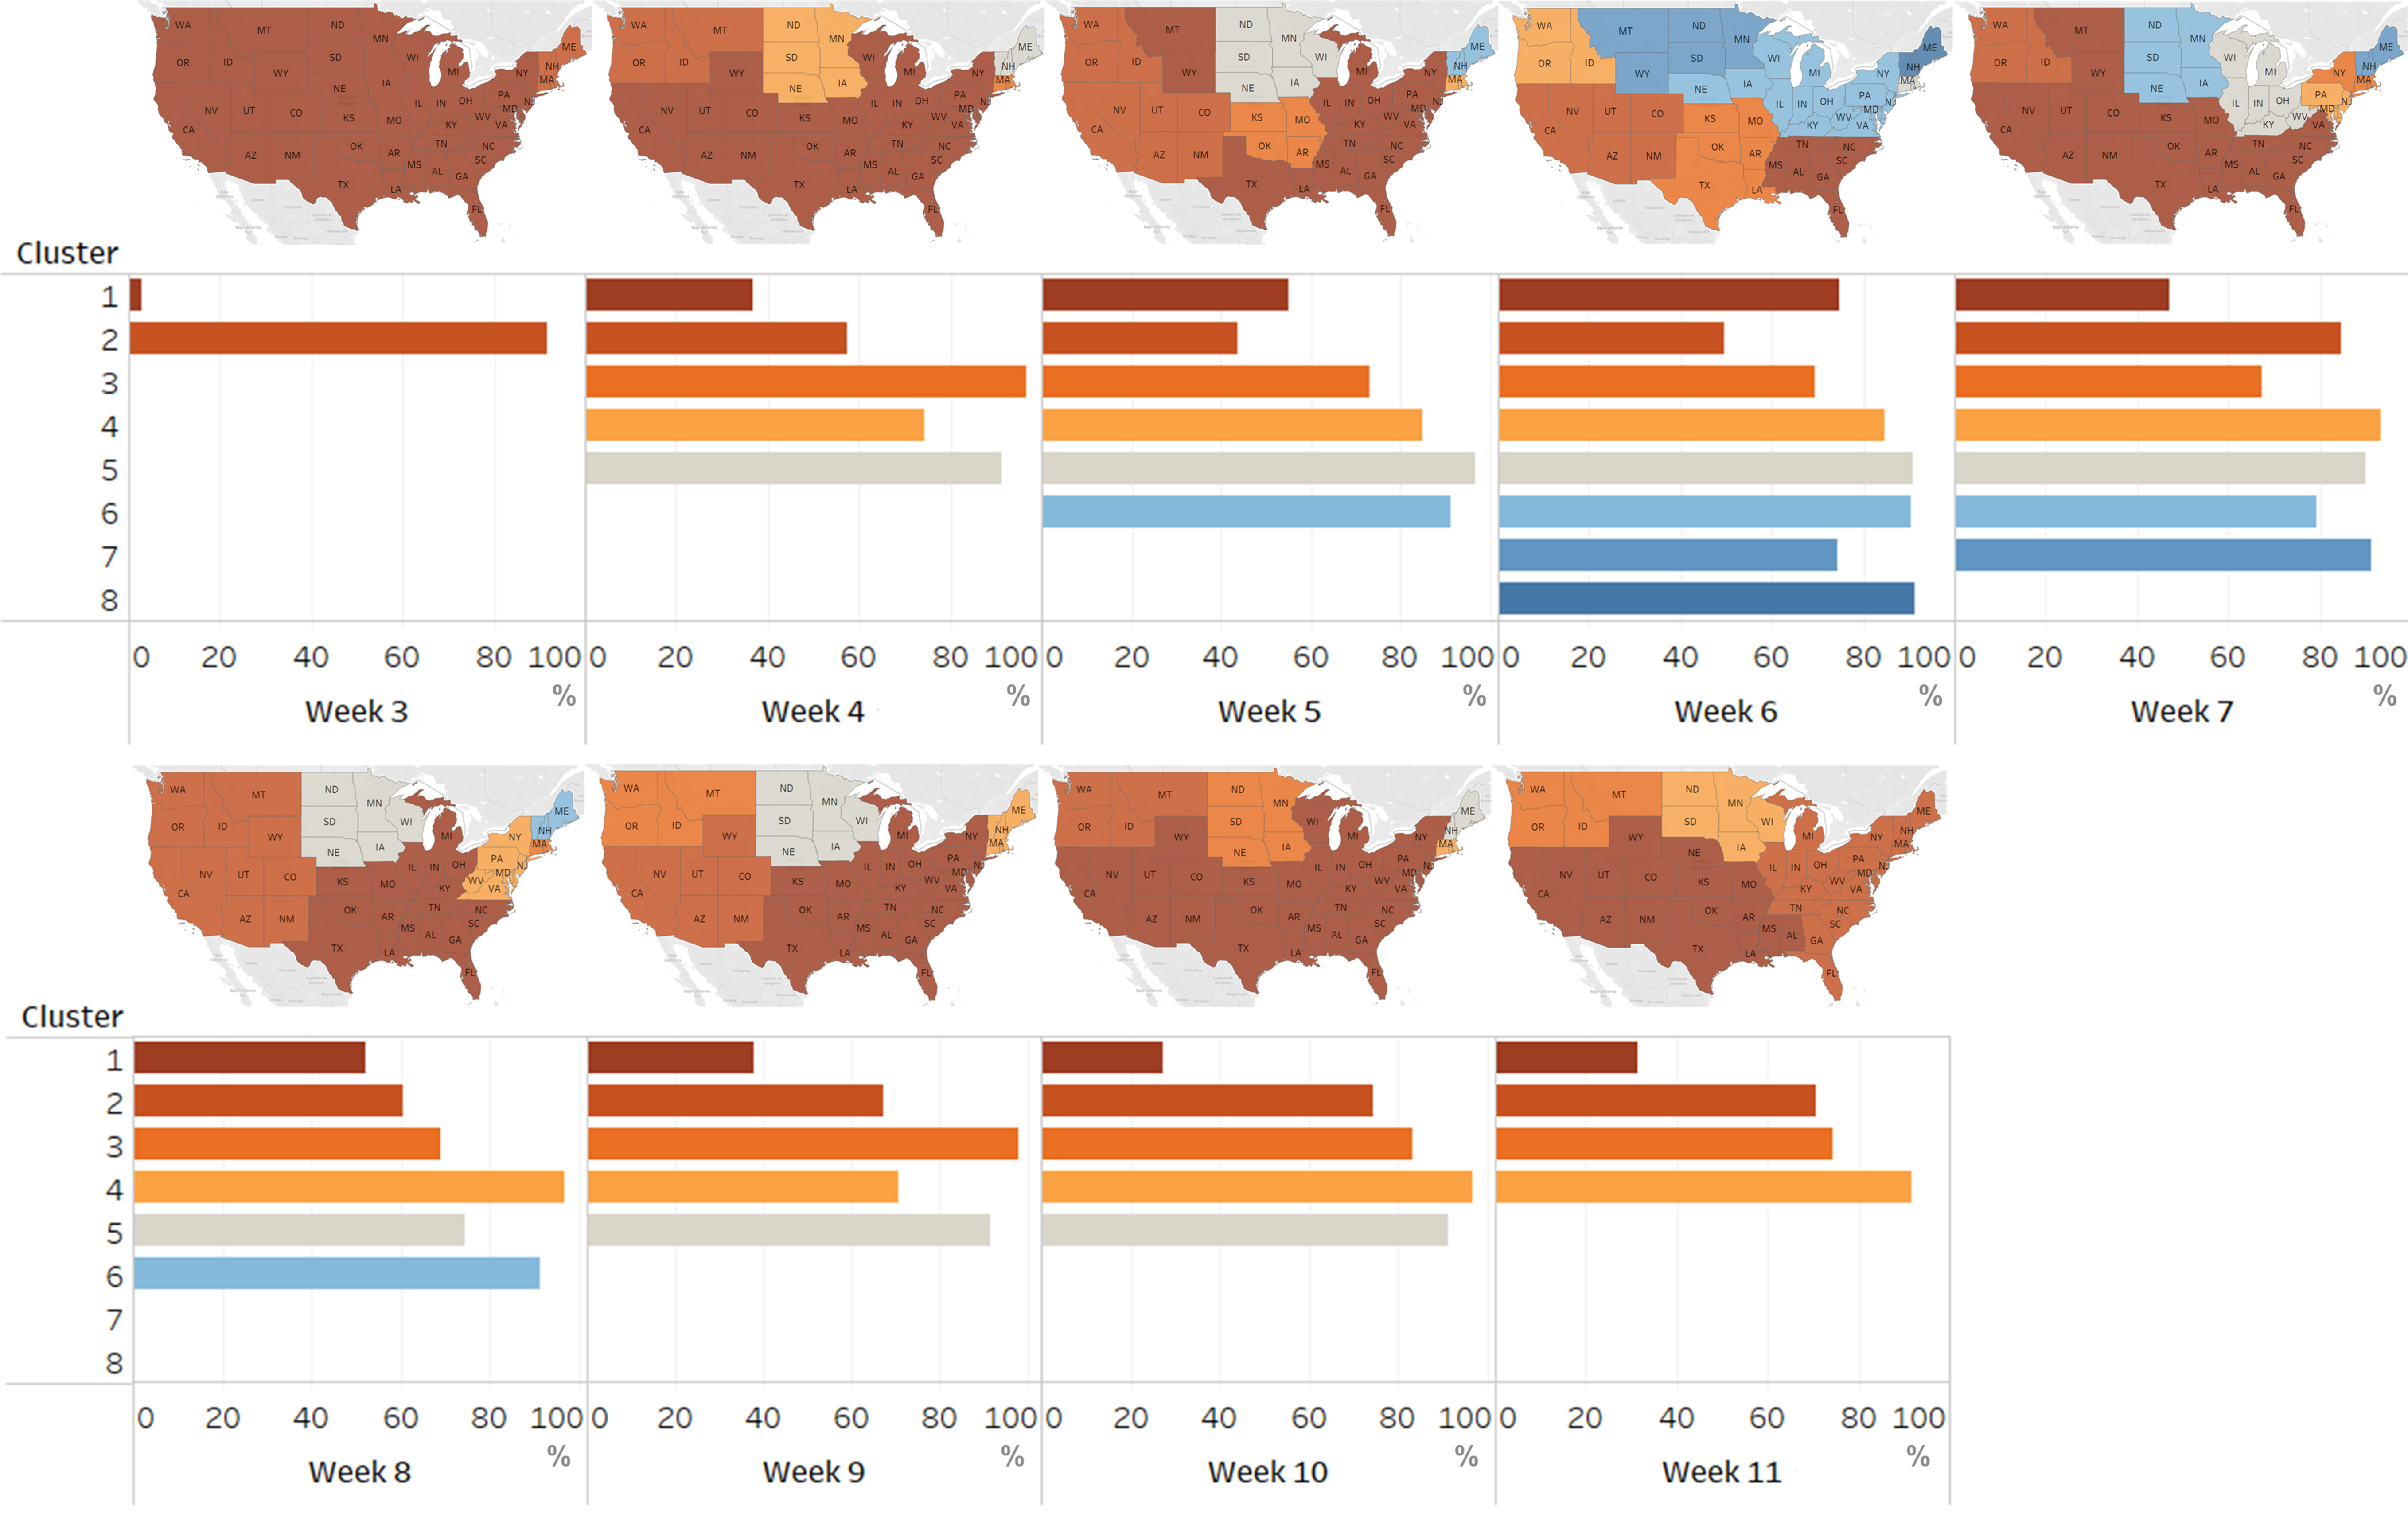
COVID-19 has been affecting every aspect of societal life including human mobility since December, 2019. In this paper, we study the impact of COVID-19 on human mobility patterns at the state level within the United States. From the temporal perspective, we find that the change of mobility patterns does not necessarily correlate with government policies and guidelines, but is more related to people's awareness of the pandemic, which is reflected by the search data from Google Trends. Our results show that it takes on average 14 days for the mobility patterns to adjust to the new situation. From the spatial perspective, we conduct a state-level network analysis and clustering using the mobility data from Multiscale Dynamic Human Mobility Flow Dataset. As a result, we find that 1) states in the same cluster have shorter geographical distances; 2) a 14-day delay again is found between the time when the largest number of clusters appears and the peak of Coronavirus-related search queries on Google Trends; and 3) a major reduction in other network flow properties, namely degree, closeness, and betweenness, of all states from the week of March 2 to the week of April 6 (the week of the largest number of clusters).
研究动机与目标
- 考察公众对新冠疫情的认知与各州人口流动模式变化之间的时序滞后。
- 利用网络分析与聚类技术,研究州际流动的空间结构。
- 量化疫情早期阶段流动网络属性(度、接近度与中介性)的变化。
- 探讨‘冠状病毒’谷歌搜索趋势与各州流动行为变化之间的关系。
- 评估从2020年3月初至4月中旬各州流动模式的演变,特别是公众关注达到顶峰时的变化。
提出的方法
- 利用苹果的新冠疫情出行趋势报告,获取2020年1月13日至7月20日期间全美各州相对每日出行流量(以1月13日为基准)。
- 整合各州层面的‘冠状病毒’谷歌趋势搜索量数据,作为公众对疫情认知与感知的代理指标。
- 以州为节点,州际出行流量为边权重,构建州级出行网络。
- 应用网络聚类算法,结合地理距离作为空间约束,识别出行模式相似的州群组。
- 为每个州计算网络中心性指标——度、接近度与中介性,以评估出行影响力与连通性的变化。
- 对比分析3月2日(疫情初期)与4月6日(隔离高峰)期间的网络属性变化,重点关注网络属性的下降情况。
![Figure 1 : The number of days of delay reflected by Apple mobility data [ 2 ] to Google search data [ 15 ] for all states. The average delay of people’s mobility adjustment to their awareness of the pandemic is 14 days.](https://ar5iv.labs.arxiv.org/html/2010.03707/assets/figures/delay.png)
实验结果
研究问题
- RQ1公众对疫情的认知(以谷歌搜索趋势为指标)与人口流动模式变化之间是否存在可测量的时间延迟?
- RQ2州际出行模式在空间上如何聚类?这些聚类是否与地理邻近性相对应?
- RQ3‘冠状病毒’谷歌搜索量的峰值与出行聚类数量最大的时刻之间存在何种时间关系?
- RQ4在疫情初期,关键网络属性——度、接近度与中介性——在全美各州中的下降程度如何?
- RQ5哪些州在出行网络中心性方面经历了最显著的下降?其地理与人口统计特征呈现出何种模式?
主要发现
- 平均而言,公众认知提升(以谷歌趋势衡量)与全美各州可观察到的人口流动模式变化之间存在14天的延迟。
- 出行聚类数量最多的时期出现在‘冠状病毒’谷歌搜索量峰值约14天后,证实了行为适应中观察到的时间延迟。
- 处于同一出行聚类的州彼此地理上更为接近,表明邻近性在塑造出行网络中起着关键作用。
- 从3月2日当周至4月6日当周,全美各州的网络中心性均出现下降:平均度减少7.7%,接近度减少6.9%,中介性减少21.6%。
- 内华达州、威斯康星州和新泽西州的中介性下降幅度最大(分别为97.8%、57.1%和53.7%),表明其作为出行枢纽的作用急剧减弱。
- 按度、接近度与中介性下降幅度排名前10位的州,其下降幅度显著,标准差分别为9.7%、4.0%与27.3%,表明各州出行中断程度存在高度差异。
更好的研究,从现在开始
从阅读论文到最终审阅,大幅缩短您的研究时间。
无需绑定信用卡
本解读由 AI 生成,并经人工编辑审核。