
[论文解读] Symfind: Addressing the Fragility of Subhalo Finders and Revealing the Durability of Subhalos
Symfind 是一种基于粒子追踪的新型亚结构子晕探测方法,通过追踪粒子从落入主晕开始的轨迹,显著提升了宇宙学模拟中亚结构子晕的检测能力,使亚结构子晕的恢复质量比 Rockstar 低一个数量级以上。该方法揭示了亚结构子晕的寿命远超以往认知,减少了对‘孤儿’子晕模型的依赖,并表明在 $n_{\text{peak}} \gtrsim 4\times10^3$ 时质量损失可被解析,而 $v_{\text{max}}$ 的准确解析则需 $n_{\text{peak}} \gtrsim 3\times10^4$。
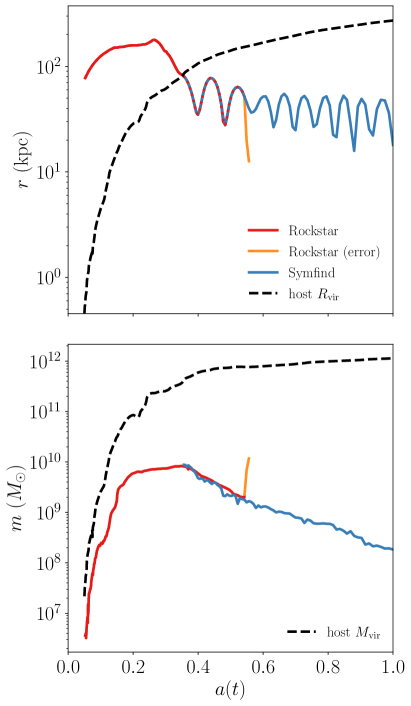
A major question in $Λ$CDM is what this theory actually predicts for the properties of subhalo populations. Subhalos are difficult to simulate and to find within simulations, and this propagates into uncertainty in theoretical predictions for satellite galaxies. We present Symfind, a new particle-tracking-based subhalo finder, and demonstrate that it can track subhalos to orders-of-magnitude lower masses than commonly used halo-finding tools, with a focus on Rockstar and consistent-trees. These longer survival mean that at a fixed peak subhalo mass, we find $\approx 15\%{-}40\%$ more subhalos within the virial radius, $R_ extrm{vir}$, and $\approx 35\%-120\%$ more subhalos within $R_ extrm{vir}/4$ in the Symphony dark-matter-only simulation suite. More subhalos are found as resolution is increased. We perform extensive numerical testing. In agreement with idealized simulations, we show that the $v_{ m max}$ of subhalos is only resolved at high resolutions ($n_ extrm{peak}\gtrsim3 imes 10^4$), but that mass loss itself can be resolved at much more modest particle counts ($n_ extrm{peak}\gtrsim4 imes 10^3$). We show that Rockstar converges to false solutions for the mass function, radial distribution, and disruption masses of subhalos. We argue that our new method can trace resolved subhalos until the point of typical galaxy disruption without invoking ``orphan'' modeling. We outline a concrete set of steps for determining whether other subhalo finders meet the same criteria. We publicly release Symfind catalogs and particle data for the Symphony simulation suite at \url{http://web.stanford.edu/group/gfc/symphony}.
研究动机与目标
- 为解决如 Rockstar 等现有子晕探测器在低质量下收敛不可靠的问题。
- 通过追踪粒子从落入到破坏的全过程,量化 $\Lambda$CDM 模拟中子晕的真实持久性。
- 确定准确测量子晕质量函数与速度函数所需的最低分辨率。
- 提供一个稳健且可测试的框架,用于基于收敛性和物理一致性评估其他子晕探测器。
提出的方法
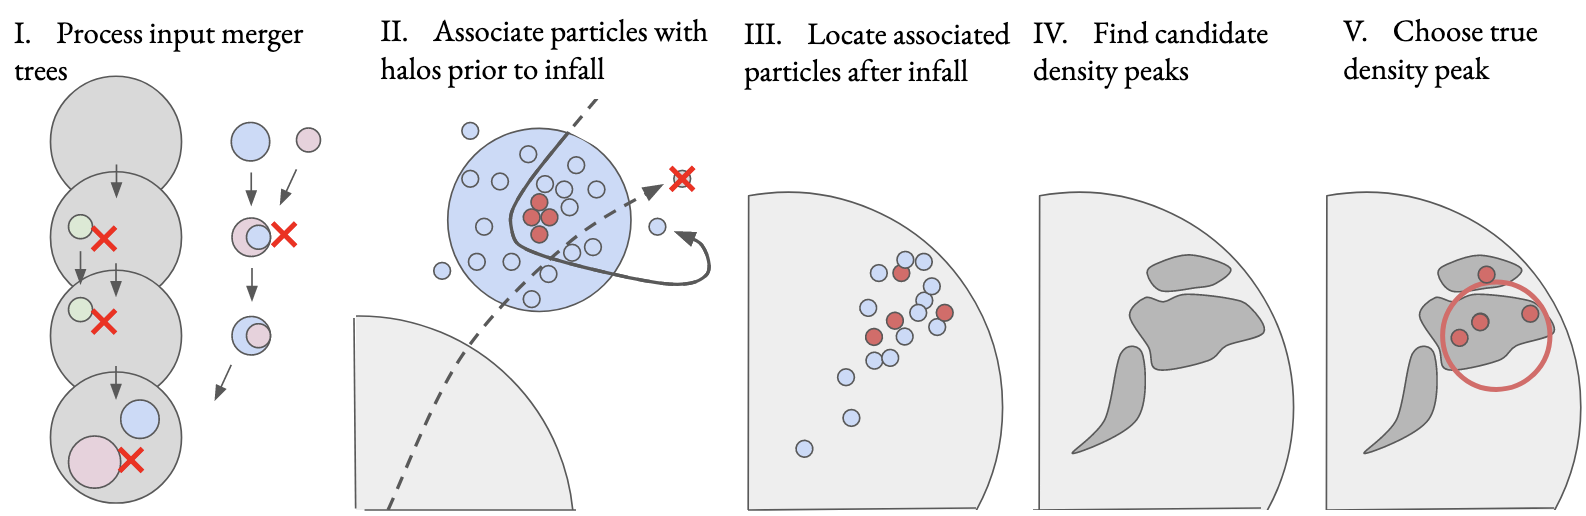
- Symfind 从子晕落入主晕时开始追踪其粒子,通过潮汐剥离过程保持其身份识别。
- 利用落入时最绑定的粒子作为种子,通过 Subfind 算法识别子晕。
- 随时间评估子晕属性(质量、$v_{\text{max}}$、$m_{\text{peak}}$)以评估其生存与破坏情况。
- 在不同分辨率水平上执行广泛的数值收敛性测试,以确定物理解析可观测量的分辨率极限。
- 将 Symfind 结果与 Rockstar 和 consistent-trees 直接比较,揭示现有工具中虚假收敛的问题。
- 引入统计校正以避免堆叠质量损失曲线中的幸存者偏差,确保质量演化追踪的准确性。
实验结果
研究问题
- RQ1随着分辨率提高,标准子晕探测器如 Rockstar 在多大程度上无法收敛,从而产生虚假的子晕群体?
- RQ2解析子晕质量损失与 $v_{\text{max}}$ 演化所需的最小粒子数 ($n_{\text{peak}}$) 是多少?
- RQ3$\Lambda$CDM 模拟中子晕的持久性如何?是否可以在不引入‘孤儿’子晕的情况下,将其追踪至星系破坏?
- RQ4堆叠质量损失曲线在多大程度上受到幸存者偏差的影响?如何加以校正?
- RQ5基于粒子追踪的方法如 Symfind 是否能在低质量子晕恢复方面优于传统的相空间探测器?
主要发现
- 在固定 $m_{\text{peak}}$ 条件下,Symfind 在 $R_{\text{vir}}$ 内比 Rockstar 多恢复 15% 至 40% 的子晕,在 $R_{\text{vir}}/4$ 内多恢复 35% 至 120% 的子晕。
- 子晕质量损失在 $n_{\text{peak}} \gtrsim 4\times10^3$ 时可被解析,而 $v_{\text{max}}$ 的准确解析则需 $n_{\text{peak}} \gtrsim 3\times10^4$。
- Rockstar 随分辨率提高出现虚假收敛,导致质量函数与径向分布不可靠。
- 幸存者偏差严重扭曲了堆叠质量损失曲线,但 Symfind 的统计校正完全消除了这一偏差。
- 由 Symfind 追踪的子晕寿命足够长,使得在 $n_{\text{peak}} > 4\times10^3$ 时无需引入‘孤儿’子晕模型。
- 该方法证实,当分辨率足够时,理想化模拟能准确预测深质量损失区域中 $v_{\text{max}}$ 的演化。
更好的研究,从现在开始
从阅读论文到最终审阅,大幅缩短您的研究时间。
无需绑定信用卡
本解读由 AI 生成,并经人工编辑审核。