
[论文解读] The Herschel Virgo Cluster Survey. XVII. SPIRE point-source catalogs and number counts
本文利用基于时间序列测光和高斯源减除的迭代源提取方法,针对赫歇尔-维加星系团巡天(Herschel Virgo Cluster Survey)在250、350和500 µm波段,独立生成了三份SPIRE点源星表。星表揭示了在200 mJy以下的数目计数出现陡峭化,表明暗弱亚毫米波星系存在强烈演化,而模型在高 flux 处表现不佳,原因在于瑞利-金斯谱谱分布(Rayleigh-Jeans SED)建模不完整。
We present three independent catalogs of point-sources extracted from SPIRE images at 250, 350, and 500 micron as a part of the Herschel Virgo Cluster Survey (HeViCS). The source positions are determined by estimating the likelihood to be a real source for each peak on the maps and the flux densities are estimated using the sourceExtractorTimeline, a timeline-based point source fitter. Afterwards, each source is subtracted from the maps, removing a Gaussian function in every position with the full width half maximum equal to that estimated in sourceExtractorTimeline. This procedure improves the robustness of our algorithm in terms of source identification. The HeViCS catalogs contain about 52000, 42200, and 18700 sources selected at 250, 350, and 500 micron above 3sigma and are ~ 75%, 62%, and 50% complete at flux densities of 20 mJy at 250, 350, 500 micron, respectively. We then measured source number counts at 250, 350, and 500 micron and we also cross-correlated the catalogs with the Sloan Digital Sky Survey to investigate the redshift distribution of the nearby sources. From this cross-correlation, we select ~2000 sources with reliable fluxes and a high signal-to-noise ratio, finding an average redshift z~0.3+/-0.22. The number counts at 250, 350, and 500 micron show an increase in the slope below 200 mJy, indicating a strong evolution in number of density for galaxies at these fluxes. In general, models tend to overpredict the counts at brighter flux densities, underlying the importance of studying the Rayleigh-Jeans part of the spectral energy distribution to refine the theoretical recipes of the models. Our iterative method for source identification allowed the detection of a family of 500 micron sources that are not foreground objects belonging to Virgo and not found in other catalogs.
研究动机与目标
- 从赫歇尔SPIRE星图中生成稳健、完整且可靠的点源星表,覆盖维加星系团区域。
- 在250、350和500 µm波段测量源的数目计数,以探究亚毫米波星系的演化特性。
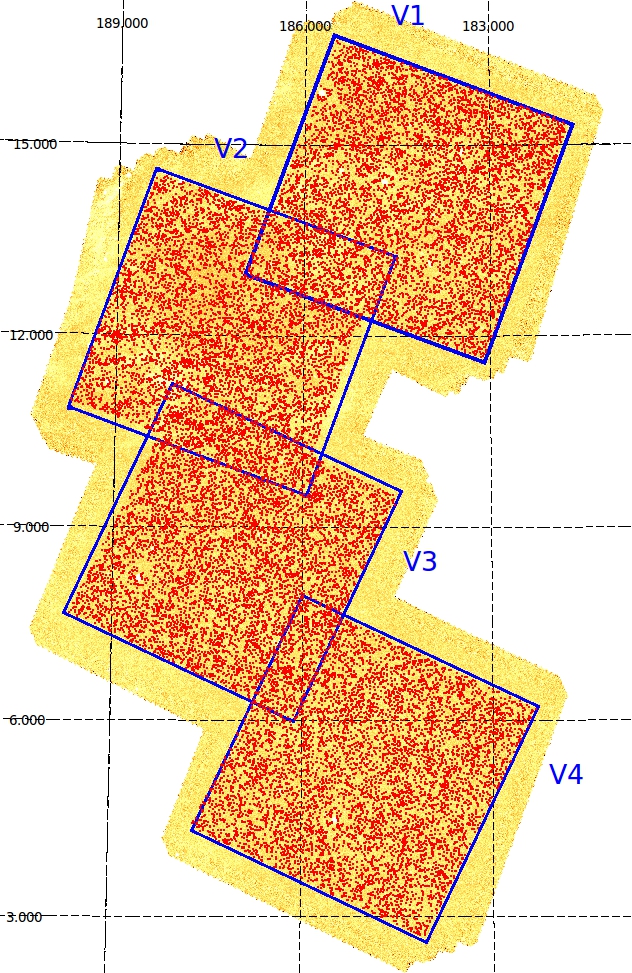
- 通过人工源注入和置换方法,评估星表的可靠性和完整性。
- 与SDSS进行交叉识别,以确定红移分布,并区分低红移与高红移星系群体。
- 评估半分析模型在观测数目计数上的表现,并识别谱谱分布函数(SED)建模中的差异。
提出的方法
- 通过迭代峰值似然估计法(使用SourceExtractorSussextractor任务)进行源检测。
- 利用sourceExtractorTimeline(一种基于时间序列的点源拟合器)进行测光估计,该方法以高斯函数建模源轮廓。
- 在每个检测到的源位置通过高斯函数移除法进行源减除,以降低混淆噪声,提升对更暗源的检测能力。
- 通过在时间序列中注入人工源并测量其恢复率,评估星表的完整性和 flux 准确性。
- 利用置换方法评估星表的可靠性,以估算虚假检测率。
- 与SDSS DR10进行交叉相关,为星表中一个子样本的源分配光学对应体和红移信息。
实验结果
研究问题
- RQ1在250、350和500 µm波段,维加星系团区域SPIRE点源星表的完整性和可靠性如何?
- RQ2亚毫米波源的数目计数在SPIRE各波段如何演化?其揭示了关于星系演化的何种信息?
- RQ3所检测源的红移分布如何?其在光学上被探测到与未被探测到的源群之间如何划分?
- RQ4为何当前的半分析模型无法准确再现高 flux 处的观测数目计数?
- RQ5瑞利-金斯谱分布部分对观测数目计数及模型偏差的影响程度如何?
主要发现
- 在3σ以上,250、350和500 µm波段的星表分别包含约52,000、42,200和18,700个源,对应20 mJy处的完整性分别为~75%、~62%和~50%。
- 数目计数在200 mJy以下呈现陡峭化趋势,表明暗弱亚毫米波星系的源密度演化强烈。
- 数目计数的斜率从250 µm向更长波长方向变得更陡,暗示高红移、高恒星形成率星系的贡献在增加。
- 在40 mJy以下,计数趋于平坦并减少,这是由于混淆噪声限制了对极暗源的可靠检测。
- 模型在高 flux 处持续高估数目计数,凸显了在理论框架中改进瑞利-金斯谱分布建模的迫切需求。
- 在SDSS中无光学对应体的源演化速度比有对应体的源更快,其谱谱分布函数(SED)与更高红移(z ~ 0.3 ± 0.22)和更冷的尘埃温度一致。
更好的研究,从现在开始
从阅读论文到最终审阅,大幅缩短您的研究时间。
无需绑定信用卡
本解读由 AI 生成,并经人工编辑审核。