
[논문 리뷰] A comprehensive guide for measuring total vanadium concentration and state of charge of vanadium electrolytes using UV-Visible spectroscopy
이 논문은 분광광도측정 적정과 스펙트럼 분해를 통해 바나디움 전해질 내 총 바나디움 농도와 충전 상태를 정확하게 측정하기 위한 검증된 UV-Vis 분광법을 제시한다. 주요 기여는 최적의 거듭제곱 법수 k=2.09를 가진 강력한 경험적 피팅 모델로, 스펙트럼 분해에서 높은 R² 값과 낮은 오차(E_X ≈ 1%)를 달성한다.
This paper presents an exhaustive how-to guide on measuring the total vanadium concentration and state of charge of vanadium electrolytes using UV-Visible spectroscopy. The study is provided with an open-access database (https://github.com/AngeAM/SOC_Vanadium_Spectra_2023.git) that supports the methods and procedures and facilitates access to the calibration data. The study covers the three types of electrolyte solutions relevant to vanadium redox flow batteries, namely the anolyte $V^{II}/V^{III}$, the catholyte $V^{IV}V^V$, and the $V^{III}/V^{IV}$ commercial electrolyte, meant to be preconditioned to either $V^{III}$ or $V^{IV}$ before battery operation. Analytical expressions to calculate the concentration of different vanadium species in the electrolyte solutions are provided based on either empirical correlations or spectral deconvolution methods. The paper also examines the limitations of the measurement technique and provides insightful recommendations for future research. The open-access database provided by the authors is expected to serve as a valuable repository for scholars and scientists working in the field of vanadium redox flow batteries.
연구 동기 및 목표
- UV-Vis 분광법을 활용하여 바나디움 전해질 내 총 바나디움 농도와 충전 상태를 신뢰할 수 있는 방법으로 정량화하는 것.
- 분광광도측정 적정을 통해 순수 상태의 종점 기반으로 복잡한 바나디움 혼합물의 정확한 종별 분석에 도전하는 것.
- 실험 오차를 최소화하기 위해 스펙트럼 분해 모델의 최적 피팅 거듭제곱 법수 k를 결정함으로써 모델 최적화를 수행하는 것.
- 경험적 평균화와 오차 분석을 통해 V(IV)/V(V) 복합체의 몰 이명도 추정 정확도를 향상시키는 것.
제안 방법
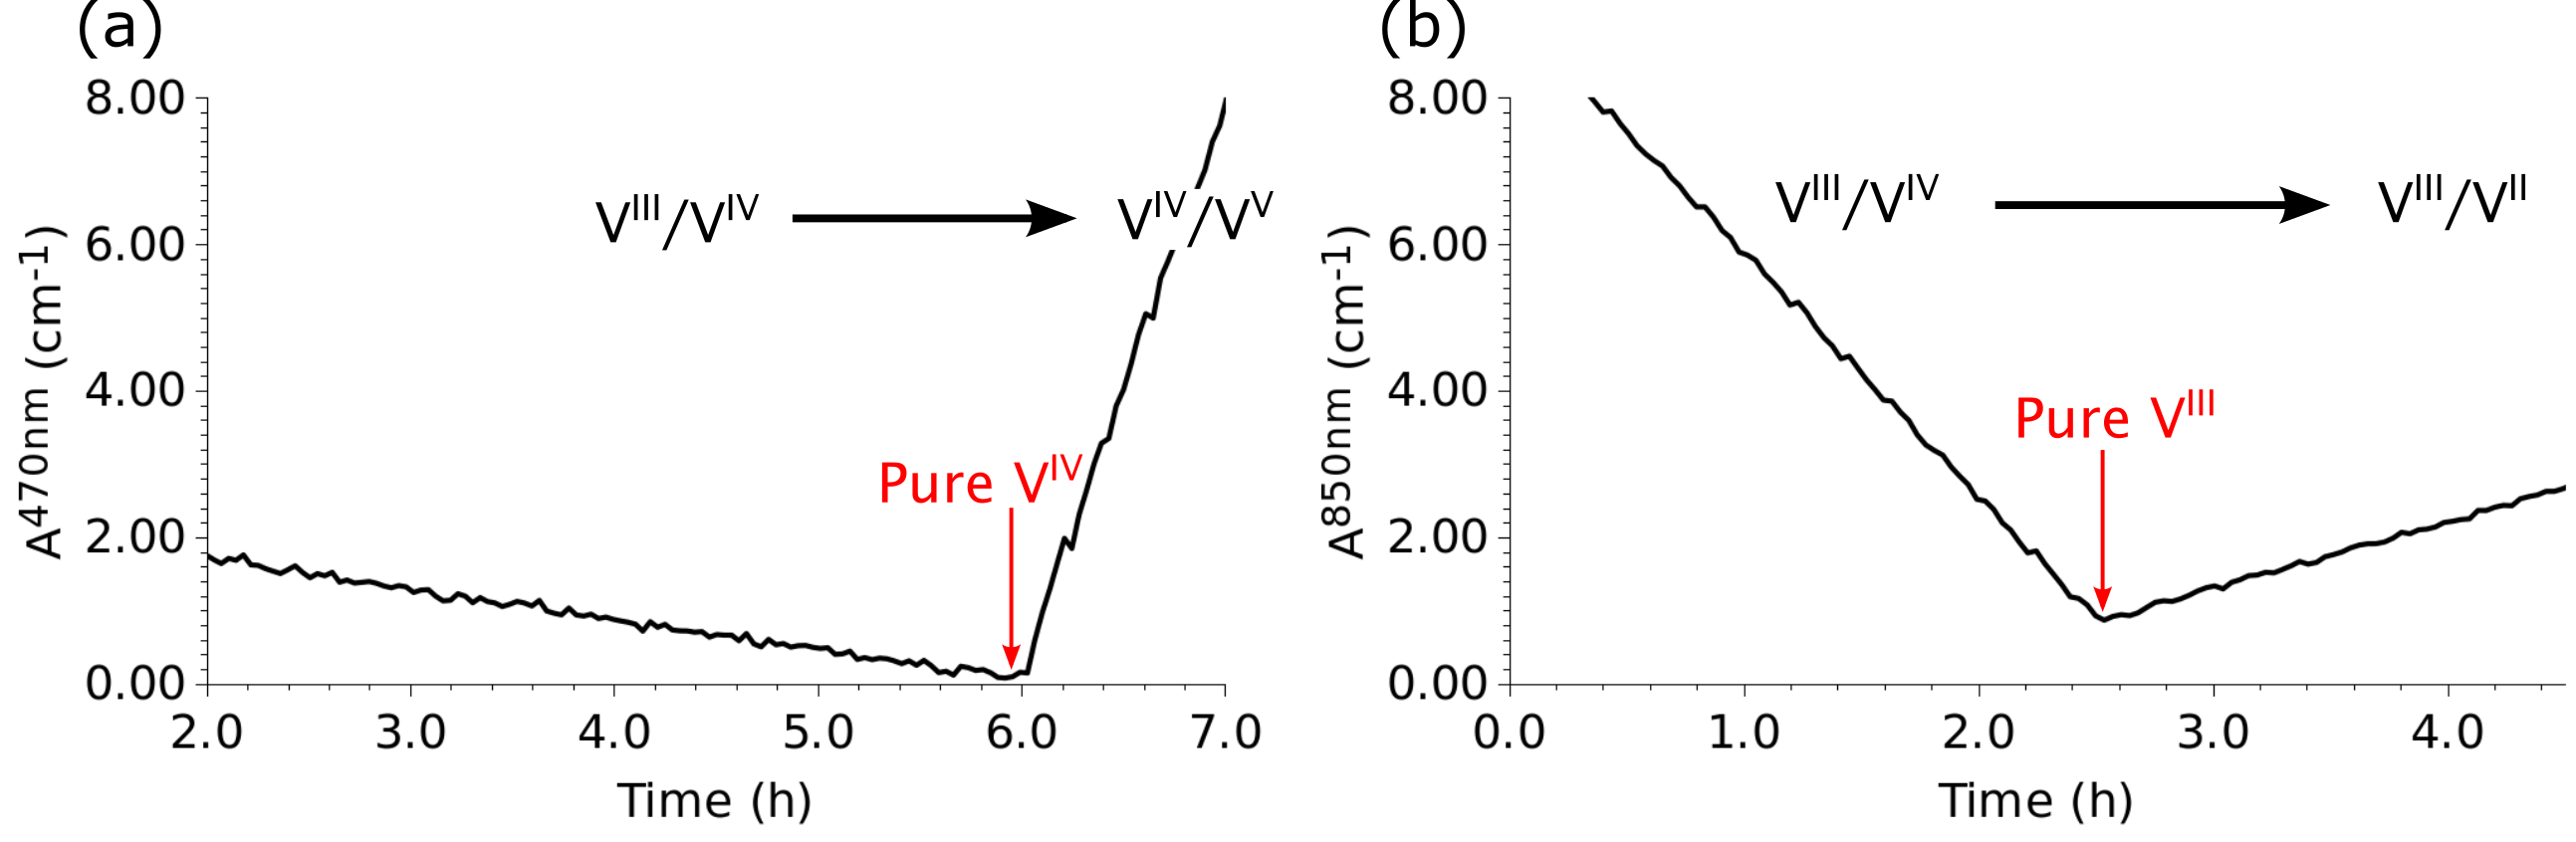
- 산화환원 전환 중 흡광도 변화를 모니터링하기 위해 분광광도측정 적정을 활용하여, V(III)/V(IV) 및 V(IV)/V(V) 시스템에서 순수 상태 종점으로서의 굴절점(Inflection point)을 식별하는 것.
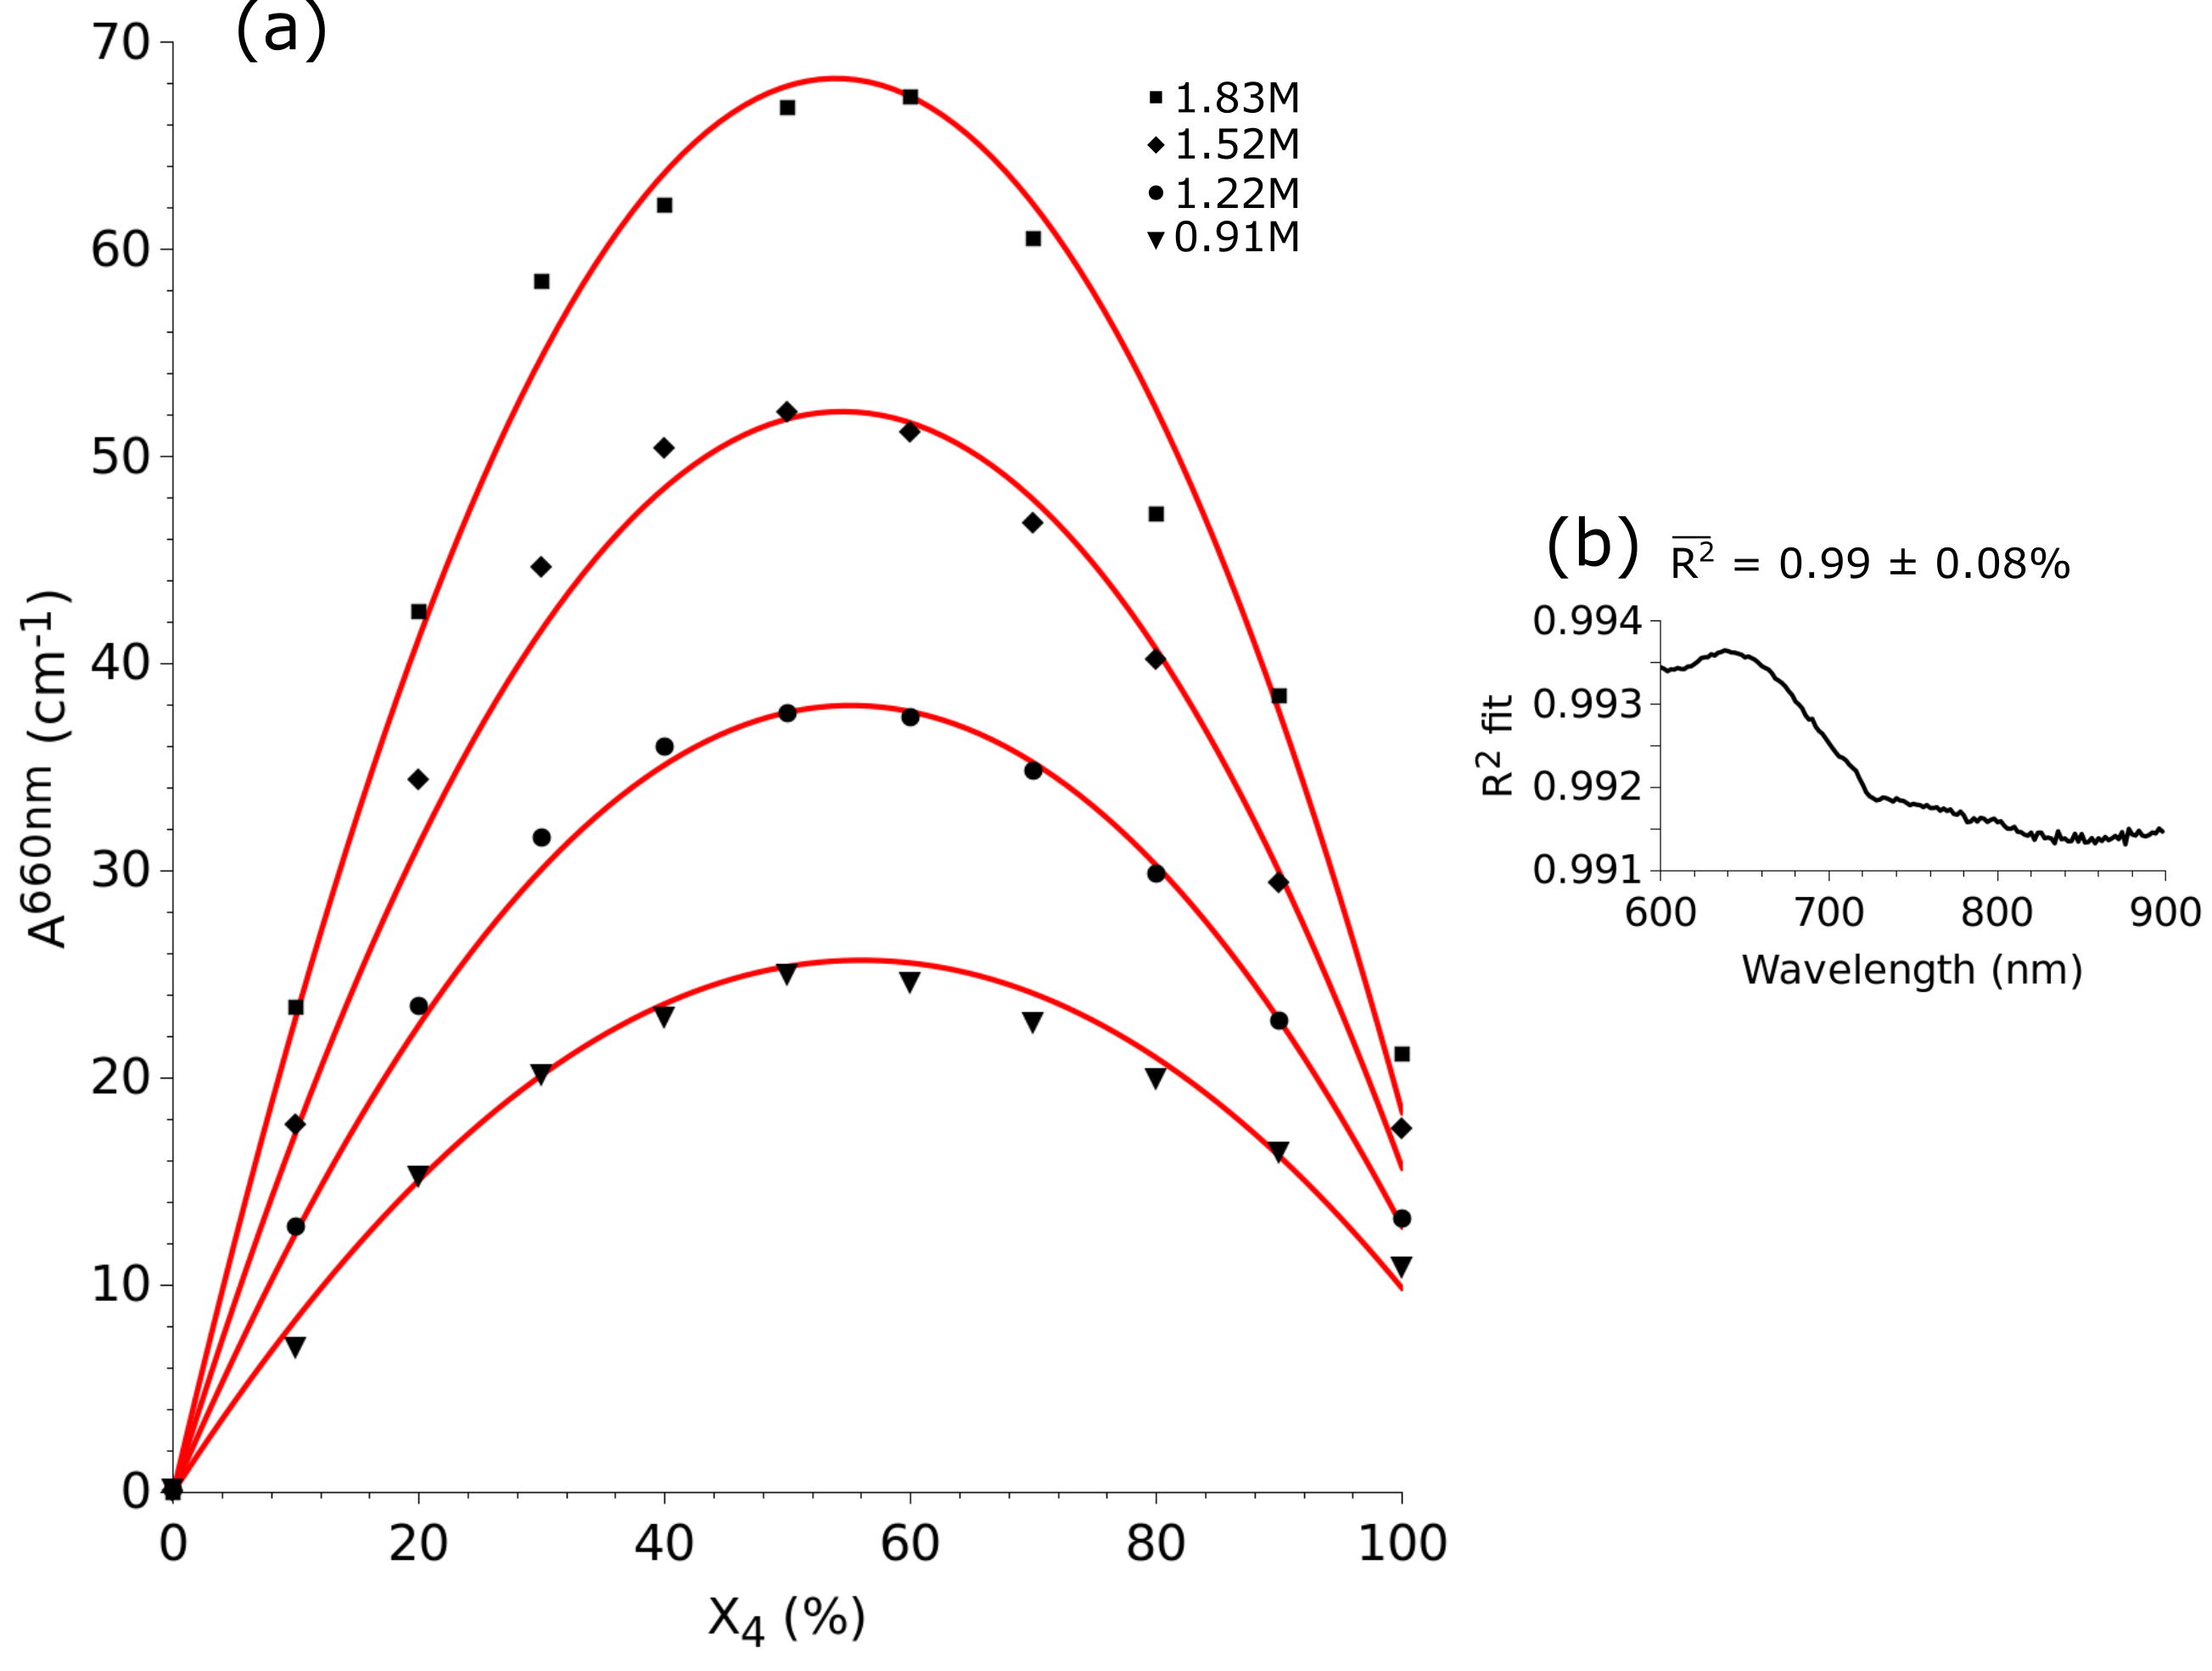
- 네 가지 농도에서 660 nm에서의 흡광도 데이터를 경험적으로 피팅하여 V(IV)/V(V) 혼합물 모델링을 수행하고, 피팅 품질을 평가하기 위해 R²를 계산하는 것.
- 식 (27)을 적용하여 36개의 교정 샘플 전역에서 복합체의 몰 이명도 ε₄₅를 계산하며, X₄ = 0% 및 100%를 제외하여 복합체 기여도를 고립하는 것.
- 계산된 ε₄₅ 값을 평균하여 교정용 기준 곡선을 생성하고, 산산분석을 통해 모델의 한계(3–12% 변동)를 규명하는 것.
- 식 (2), (27), (28)에서 거듭제곱 법수 k의 최적화를 위한 매개변수 연구를 수행하여 근사 제곱 오차의 곱(E_X₄ 및 E_C)을 최소화하는 것.
- 오차 곱의 명확한 최소값을 기반으로 k = 2.09를 최적 값으로 선정하며, 이는 440 nm에서의 단파장 분석 결과와 일관된 것으로 확인된다.
실험 결과
연구 질문
- RQ1바나디움 전해질 분석에서 스펙트럼 분해 오차를 최소화하는 데 최적의 거듭제곱 법수 k는 무엇인가?
- RQ2UV-Vis 흡광도 데이터의 경험적 피팅을 통해 총 바나디움 농도와 산화 상태를 얼마나 정확하게 결정할 수 있는가?
- RQ3다양한 농도 및 조성에서 V(IV)/V(V) 복합체의 몰 이명도는 어느 정도 변동하며, 대표적인 값을 신뢰성 있게 유도할 수 있는가?
- RQ4분광광도측정 적정을 통해 바나디움 전해질의 교정 목적에서 순수 산화 상태 종점을 신뢰성 있게 식별할 수 있는가?
- RQ5비선형 효과가 흡광도 모델의 정확도에 미치는 영향은 무엇이며, 이를 어떻게 향상시킬 수 있는가?
주요 결과
- 660 nm에서의 흡광도 경험적 피팅은 높은 결정계수(R²)를 달성하여 실험값과 예측값 간의 강한 일치를 확인한다.
- 스펙트럼 분해의 최적 거듭제곱 법수는 k = 2.09로 결정되었으며, 이는 산화 상태(E_X₄)와 총 농도(E_C) 오차의 조합을 최소화한다.
- 복합체의 평균 몰 이명도 ε₄₅는 분해 과정에서 약 1%의 근사 제곱 오차를 유도하여 높은 정확도를 나타낸다.
- 높은 R² 값에도 불구하고 개별 ε₄₅ 값에서 3–12%의 산산분포가 관찰되어 비선형 효과가 현재 모델 정확도를 제한할 수 있음을 시사한다.
- k = 2.09는 이전에 보고된 440 nm에서의 단파장 분석 결과 k = 1.88과 일관되며, 그 신뢰성을 뒷받침한다.
- 분광광도측정 적정은 산화 시 470 nm, 환원 시 850 nm에서 명확한 굴절점을 식별하여 기준 전해질 제조를 위한 정밀한 종점 검출이 가능함을 입증했다.
더 나은 연구,지금 바로 시작하세요
논문 읽기부터 검토까지, 연구 시간을 획기적으로 줄여보세요.
카드 등록 없음 · 무료 플랜 제공
이 리뷰는 AI가 만들고, 인간 에디터가 검토했습니다.