[논문 리뷰] A Cross-Domain Approach to Analyzing the Short-Run Impact of COVID-19 on the U.S. Electricity Sector
이 논문은 COVID-EMDA +라는 도메인 간 데이터 허브를 도입하여 전력시장 데이터와 COVID-19 보건, 이동성, 위성 데이터를 통합하고, 제한된 VAR 모델을 사용하여 미국 내 지역 간 시장들에 걸친 단기 전력 소비에 대한 COVID-19의 영향력을 정량화한다.
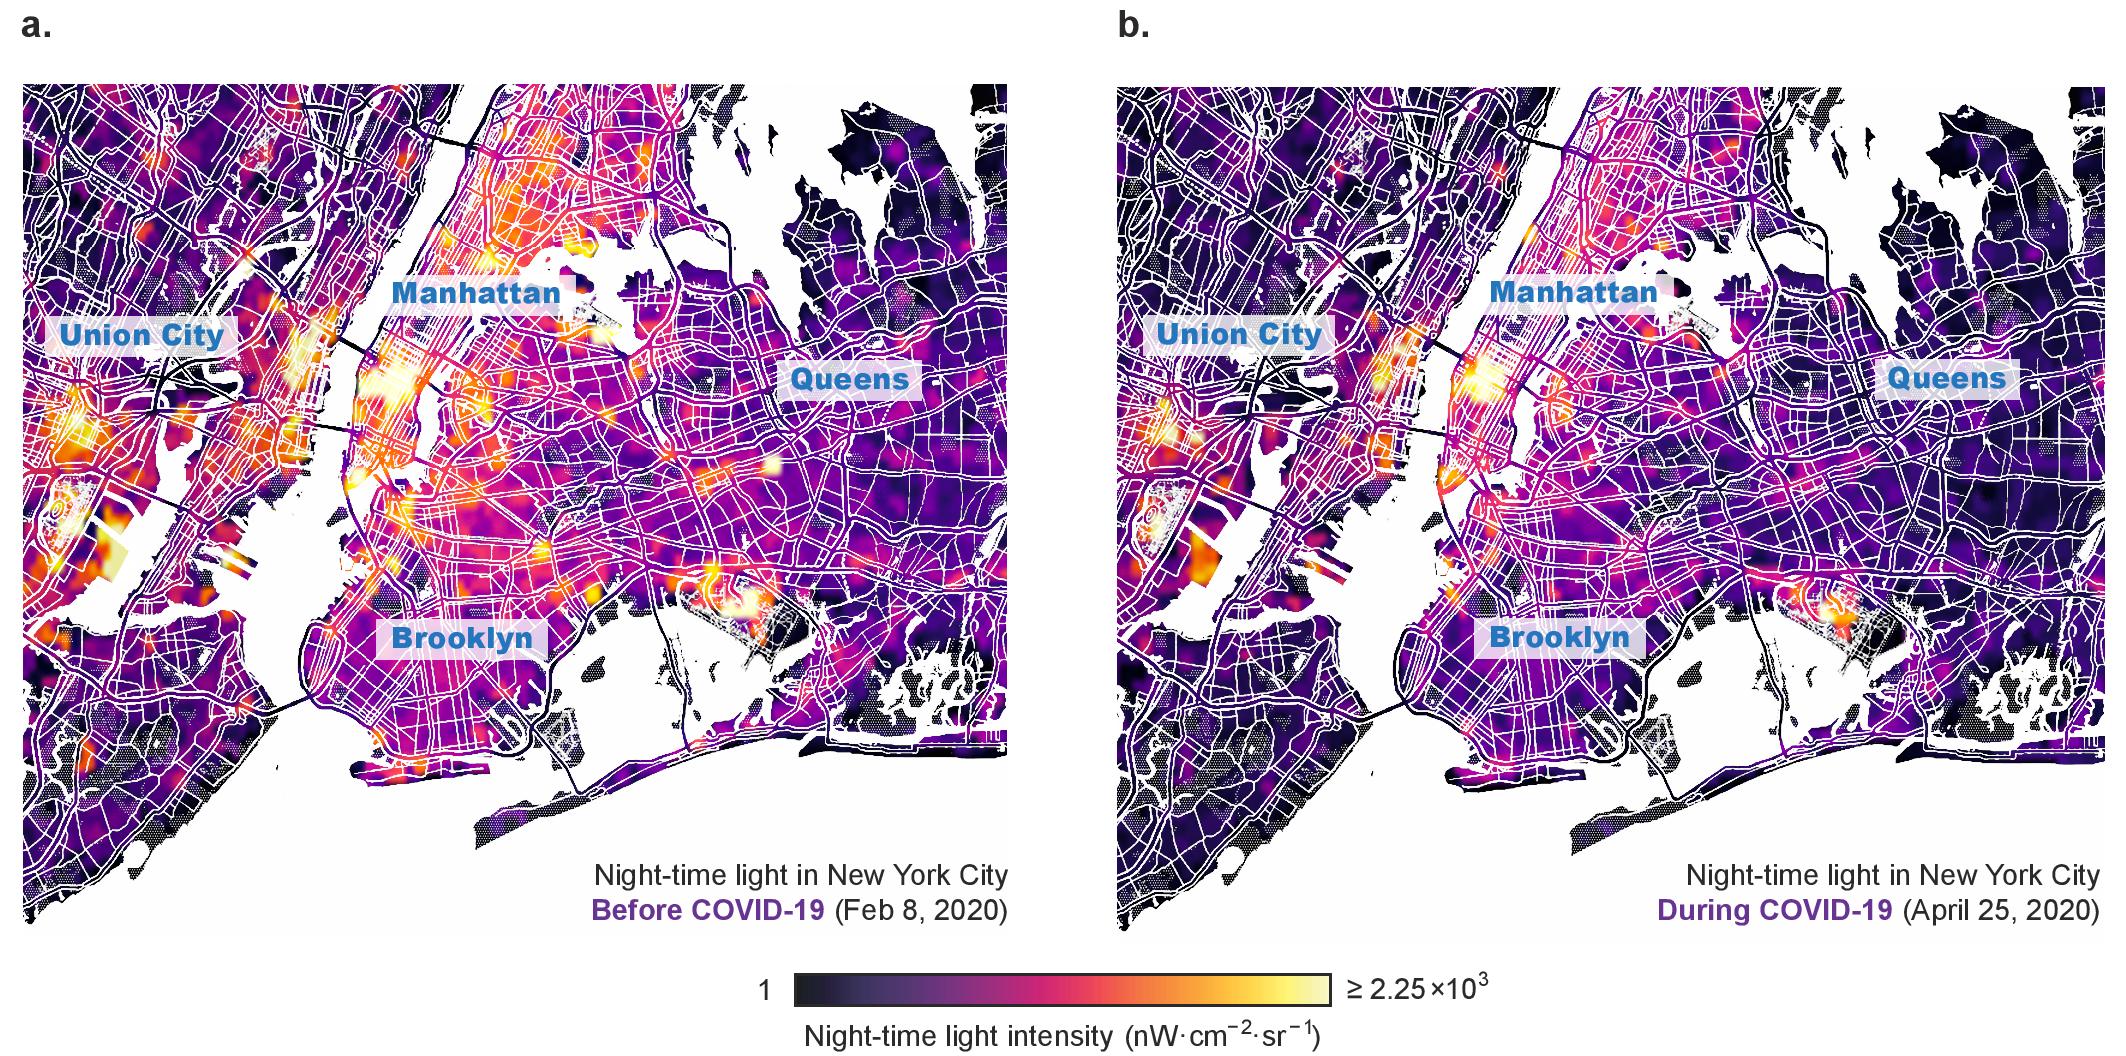
The novel coronavirus disease (COVID-19) has rapidly spread around the globe in 2020, with the U.S. becoming the epicenter of COVID-19 cases since late March. As the U.S. begins to gradually resume economic activity, it is imperative for policymakers and power system operators to take a scientific approach to understanding and predicting the impact on the electricity sector. Here, we release a first-of-its-kind cross-domain open-access data hub, integrating data from across all existing U.S. wholesale electricity markets with COVID-19 case, weather, cellular location, and satellite imaging data. Leveraging cross-domain insights from public health and mobility data, we uncover a significant reduction in electricity consumption across that is strongly correlated with the rise in the number of COVID-19 cases, degree of social distancing, and level of commercial activity.
연구 동기 및 목표
- COVID-19로 인한 전력 수요 영향 평가를 위한 도메인 간 분석의 필요성 제시
- 전력시장을 보건, 이동성, 기상, 위성 데이터와 통합하는 오픈 액세스 데이터 허브(COVID-EMDA +) 구축
- 교차 도메인 지표에 비례한 전력 소비 변화의 정량화 위한 통계적 프레임워크 개발
- 지역별 및 도시별 감소 폭을 정량화하고 로드 변화의 주요 원인을 식별
제안 방법
- 전력 시장, 기상, COVID-19 사례 데이터, 이동성(SafeGraph), 위성 이미지 데이터를 통합하는 오픈 액세스 데이터 허브 COVID-EMDA + 구성
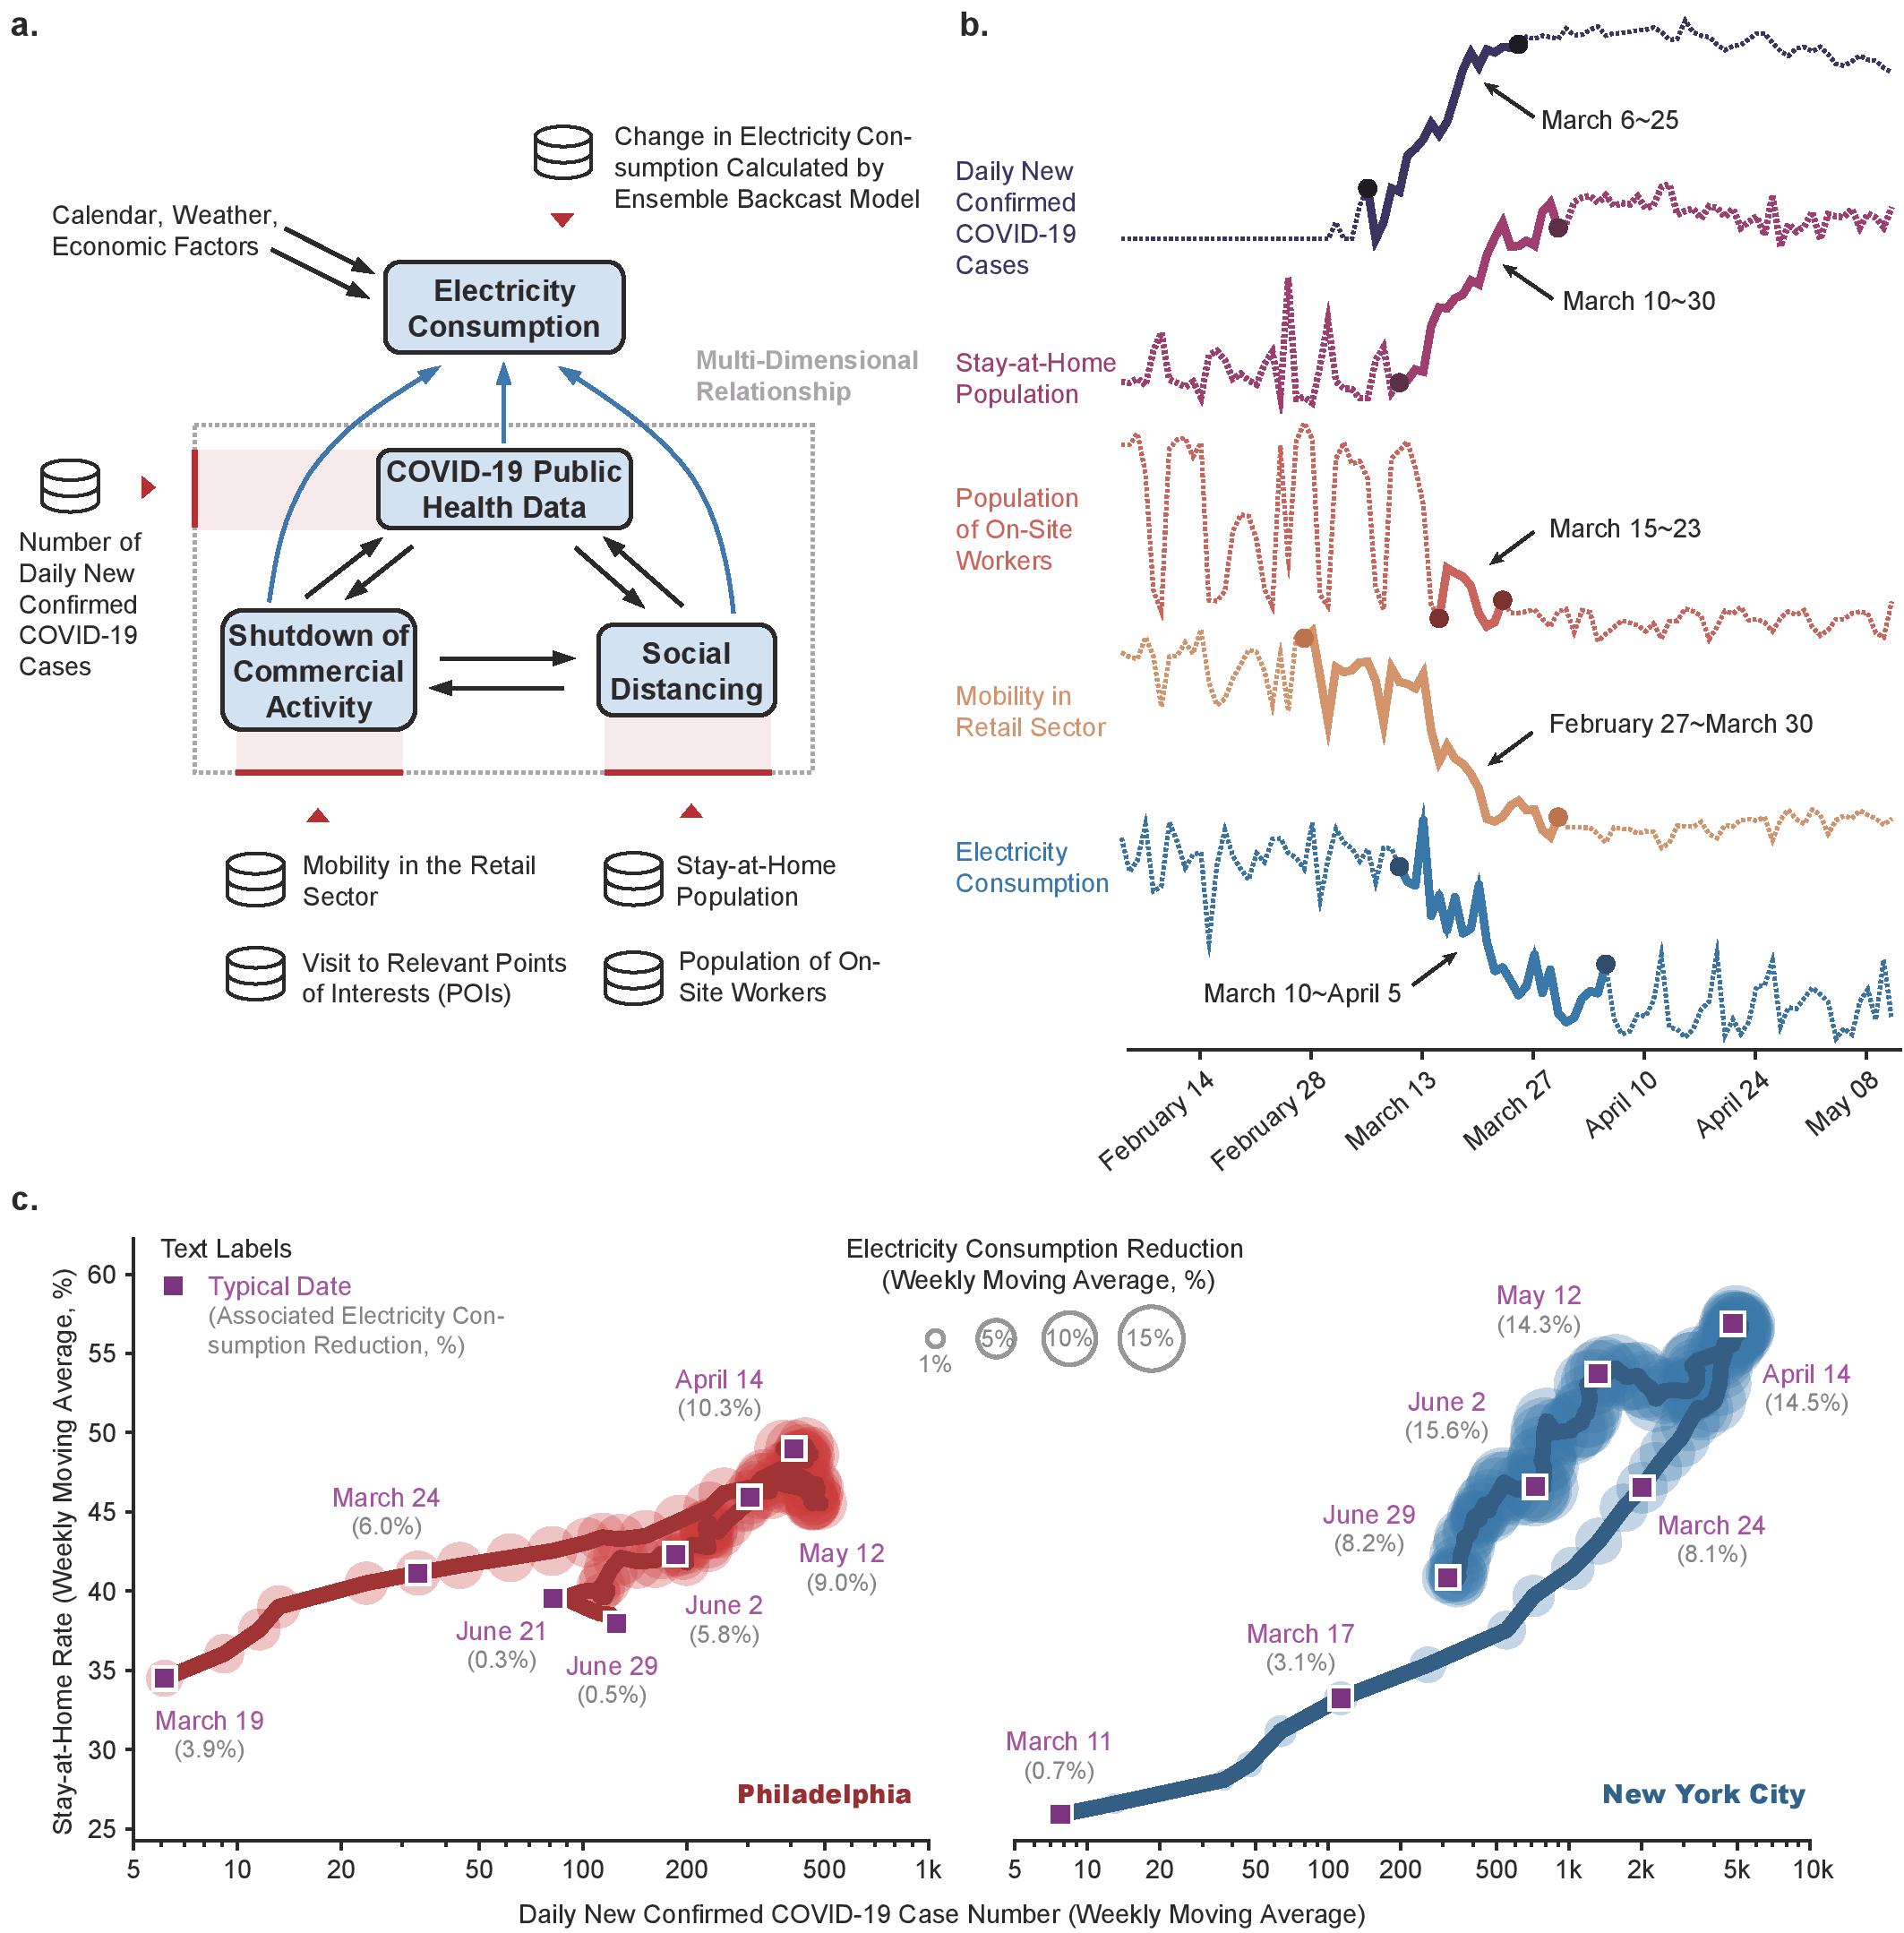
- 날씨, 달력, GDP 성장 요인을 고려한 COVID-전 이전의 전력 소비를 추정하는 앙상블 백캐스트 모델 개발
- 도시별 제한 벡터 자기회귀(RV AR) 모델을 교차 요인의 전력 소비 영향 분석 및 분산 분해 및 충격 반응 분석 수행
- 지오코딩 및 데이터 표준화를 통해 이질적 데이터 소스를 공통 시간 해상도 및 지리적 해상도로 정렬
- 크로스-마켓 및 크로스-도시의 전력 소비 감소(April–June 2020) 평가 및 교차 도메인 요인과의 관련성 분석
실험 결과
연구 질문
- RQ1COVID-19, 사회적 거리두기 및 소매 모빌리티가 미국 시장과 도시 간의 전력 소비 변화와 어떻게 관련되어 있는가?
- RQ2공중 보건 지표, 사회적 거리두기 지표, 상업 활동의 상대적 중요도는 로드 감소를 설명하는 데 얼마나 기여하는가?
- RQ3요인 간 다이나믹 시계열 차이가 전력 소비에 지연 효과를 만들어내는가?
- RQ4팬데믹 기간에 크로스 도메인 데이터가 단기 로드 예측 및 정책 평가에 도움을 주는가?
주요 결과
| 시장/도시 | 2월 | 3월 | 4월 | 5월 | 6월 |
|---|---|---|---|---|---|
| CAISO | -1.31 | 2.68 | 9.24 | 6.46 | 0.29 |
| MISO | -0.14 | 1.77 | 10.24 | 10.71 | 3.49 |
| ISO-NE | 2.15 | 5.24 | 9.47 | 10.44 | 1.79 |
| NYISO | 0.84 | 4.51 | 10.20 | 10.47 | 5.72 |
| PJM | 0.54 | 2.68 | 9.44 | 7.35 | 0.14 |
| SPP | -0.90 | 2.47 | 7.72 | 9.24 | 2.66 |
| ERCOT | -1.52 | 1.30 | 6.36 | 4.44 | 2.41 |
| Boston | 0.40 | 7.12 | 11.32 | 9.36 | 0.41 |
| Chicago | 0.09 | 2.95 | 9.81 | 9.51 | 3.24 |
| Houston | -0.55 | -0.53 | 5.33 | 3.63 | 4.41 |
| Kansas City | 0.10 | 0.24 | 9.04 | 7.01 | 0.21 |
| Los Angeles | -1.12 | 3.32 | 11.06 | 3.91 | -1.90 |
| New York City | 0.43 | 5.27 | 14.10 | 14.77 | 11.07 |
| Philadelphia | 0.75 | 3.94 | 8.93 | 8.24 | 2.07 |
- 모든 미국 전력 시장에서 2020년 4월과 5월에 걸쳐 감소가 관찰되었으며, 4월은 6.36%에서 10.24%까지, 5월은 4.44%에서 10.71%까지였습니다.
- 뉴욕 ISO (NYISO) 및 MISO에서 가장 큰 감소가 나타난 반면 ERCOT 및 SPP는 상대적으로 작았습니다.
- 소매 모빌리티(상업 활동)가 도시 전반의 로드 감소에 가장 중요한 영향력을 가지며 다양한 시장에서 민감도가 정량적으로 나타납니다(예: 휴스턴: 1% 소매 모빌리티 감소 ≈ 0.78% 정상 상태 로드 감소).
- 신규 COVID-19 확진자 수는 충격 반응에서 소비에 대한 직접적 영향이 약해 사회적 거리두기 및 상업 활동을 통한 간접 효과를 시사합니다.
- 도시 수준 분석은 밀집 도시 지역(예: NYC, 보스턴)이 분산된 지역(예: 휴스턴)보다 더 큰 감소를 겪었음을 보여줍니다.
- 크로스 도메인 인사이트는 지역별 이질적 동태를 드러내며 정책 및 운영 의사결정을 위한 위치 보정 분석의 필요성을 나타냅니다.
더 나은 연구,지금 바로 시작하세요
연구 설계부터 논문 작성까지, 연구 시간을 획기적으로 줄여보세요.
카드 등록 없음 · 무료 플랜 제공
이 리뷰는 AI가 만들고, 인간 에디터가 검토했습니다.