
[논문 리뷰] Amalgame: Cosmological Constraints from the First Combined Photometric Supernova Sample
이 논문은 저 redshift 스펙트럼적 앵커 없이 두 개의 광학적 초신성 샘플(SDSS 및 Pan-STARRS)을 조합한 첫 번째 천체물리적 분석인 Amalgame를 제시한다. 샘플 간 일관성이 1σ 이내임을 입증하고, 평탄한 ΛCDM 모델에서 ΩM = 0.328 ± 0.024를 도출하며, 광학적 샘플이 스펙트럼적 샘플과 비교해도 탄탄한 천체물리적 제약 조건을 제공할 수 있음을 보여준다.
Future constraints of cosmological parameters from Type Ia supernovae (SNe Ia) will depend on the use of photometric samples, those samples without spectroscopic measurements of the SNe Ia. There is a growing number of analyses that show that photometric samples can be utilised for precision cosmological studies with minimal systematic uncertainties. To investigate this claim, we perform the first analysis that combines two separate photometric samples, SDSS and Pan-STARRS, without including a low-redshift anchor. We evaluate the consistency of the cosmological parameters from these two samples and find they are consistent with each other to under $1σ$. From the combined sample, named Amalgame, we measure $Ω_M = 0.328 \pm 0.024$ with SN alone in a flat $Λ$CDM model, and $Ω_M = 0.330 \pm 0.018$ and $w = -1.016^{+0.055}_{-0.058}$ when combining with a Planck data prior and a flat $w$CDM model. These results are consistent with constraints from the Pantheon+ analysis of only spectroscopically confirmed SNe Ia, and show that there are no significant impediments to analyses of purely photometric samples of SNe Ia.
연구 동기 및 목표
- 저 redshift 스펙트럼적 앵커에 의존하지 않고, 두 주요 광학적 초신성 샘플(SDSS 및 Pan-STARRS) 간의 천체물리적 일관성을 평가하기 위해.
- 광학적 샘플만으로도 최소한의 체계적 불확실성을 가진 측정치를 도출할 수 있는지 테스트하기 위해.
- 다양한 광학적 데이터셋을 조합하는 방식을 검증함으로써 향후 대규모 광학적 Ia 초신성 샘플의 기초를 마련하기 위해.
- BEAMS 및 광학적 분류기의 효과성을 입증하여 천체물리적 분석에서 비-Ia 오염을 최소화할 수 있음을 보여주기 위해.
제안 방법
- 저 redshift 스펙트럼적 앵커를 제외하고 SDSS 및 Pan-STARRS 광학적 초신성 샘플을 하나의 데이터셋인 Amalgame로 통합한다.
- SNN 등의 광학적 분류기를 적용하여 Ia 확률(PIa > 0.5)을 할당하고 비-Ia 초신성의 오염을 줄인다.
- BEAMS 방법을 사용하여 Ia 확률에 따라 거리 측정치를 가중함으로써 오염이 존재하더라도 탄탄한 천체물리적 추론이 가능하도록 한다.
- 데이터 및 시뮬레이션에서 일관된 β 값을 사용하는 SALT2mu 광선곡선 피팅기를 적용하여 허블 잔차 지표에 대한 편향을 방지한다.
- Dust2Dust 및 경계가 있는 시뮬레이션을 적용하여 체계적 오차를 평가하며, 색상 대 허블 잔차 산란 및 내재 산란 σ_int을 포함한다.
- χ² 적합도 검정을 다양한 지표(예: μ_res, σ_r, β_int)에 대해 수행하여 모델이 데이터와 일치하는지 검증한다.
실험 결과
연구 질문
- RQ1저 redshift 스펙트럼적 앵커 없이도 두 개의 독립적인 광학적 초신성 샘플(SDSS 및 Pan-STARRS)이 일관된 천체물리적 제약 조건을 도출할 수 있는가?
- RQ2BEAMS 및 광학적 분류기를 사용할 경우, 비-Ia 오염이 있는 광학적 샘플이 천체물리적 파rameter 추정에 얼마나 영향을 미치는가?
- RQ3Pantheon+와 같이 스펙트럼적으로 확인된 샘플과 비교했을 때, 통합 광학적 샘플의 천체물리적 제약 조건은 어떻게 다른가?
- RQ4데이터 및 시뮬레이션에서 일관되지 않은 β 값이 초래하는 체계적 오차는 무엇이며, 이를 어떻게 수정할 수 있는가?
- RQ5핵합성 SNe를 제외한 경계가 있는 시뮬레이션은 BEAMS와 조합되었을 때 관측 데이터를 정확히 대체할 수 있는가?
주요 결과
- SDSS 및 Pan-STARRS 광학적 샘플 간의 천체물리적 제약 조건은 1σ 이내에서 일관성이 있다.
- Amalgame 샘플은 평탄한 ΛCDM 모델에서 오직 Ia 초신성만을 사용하여 ΩM = 0.328 ± 0.024를 도출한다.
- 평탄한 wCDM 모델에서 Planck 사전정보를 통합했을 때, Amalgame 샘플은 ΩM = 0.330 ± 0.018 및 w = -1.016⁺⁰.⁰⁵⁵₋₀.⁰⁵⁸를 도출한다.
- 결과는 스펙트럼적으로 확인된 Ia 초신성 샘플인 Pantheon+ 분석 결과와 일치하며, 광학적 샘플 전용일지라도 상당한 정확도 저하가 없음을 시사한다.
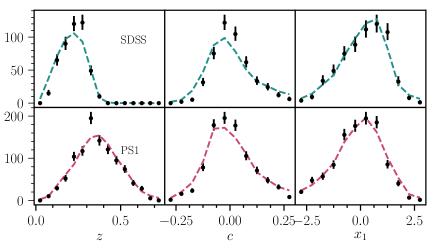
- χ² 적합도 지표(예: μ_res, σ_r)는 데이터와 시뮬레이션 간 양호한 일치를 보이며, 허블 잔차 산란에 대해 각각 고질량일 경우 27.3, 저질량일 경우 13.1의 χ² 값을 기록한다.
- μ 및 μ_ERR에서 일관된 β 값을 확보하기 위해 σ_int 계산에 수정을 가했으며, 이는 내재 산란의 과대평가 문제를 해결하였다.
더 나은 연구,지금 바로 시작하세요
논문 읽기부터 검토까지, 연구 시간을 획기적으로 줄여보세요.
카드 등록 없음 · 무료 플랜 제공
이 리뷰는 AI가 만들고, 인간 에디터가 검토했습니다.