
[논문 리뷰] An HSC view of the CMASS galaxy sample. Halo mass as a function of stellar mass, size and Sérsic index
이 연구는 깊은 HSC 강성 사진 및 약한 중력 렌즈를 사용하여 CMASS은하의 어둠성 물질 허브 질량이 항성 질량, 크기, 세르시크 지수에 따라 어떻게 변하는지 측정한다. 연구 결과, 허브 질량는 항성 질량에 따라 $ M_{\text{halo}} \propto M_*^{1.7} $로 스케일링되며, 고정된 항성 질량에서 크기나 세르시크 지수에 대한 유의미한 의존성이 없음을 확인하여, 고질량 허브에서 크기 성장이 더 효율적이라는 모델을 반박한다.
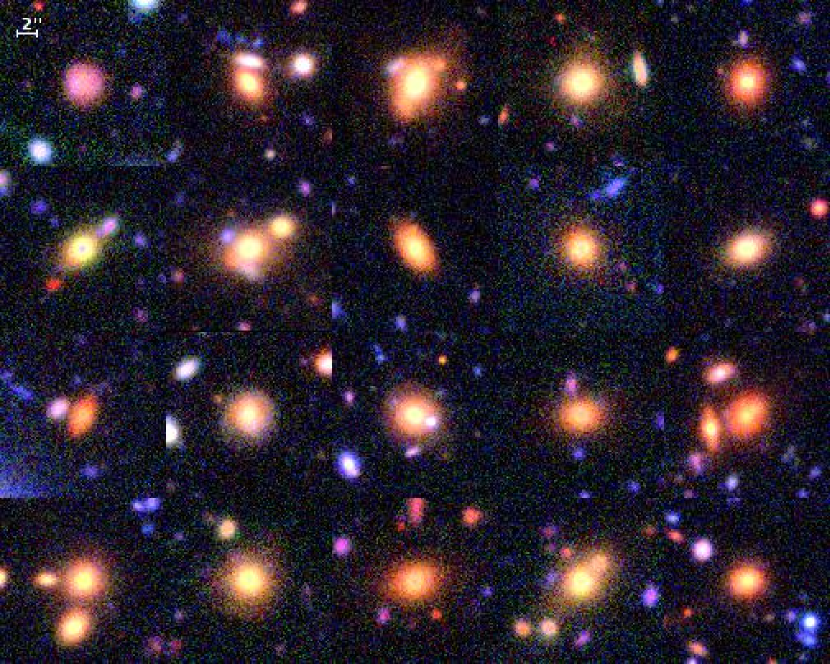
Aims. We wish to determine the distribution of dark matter halo masses as a function of the stellar mass and the stellar mass profile, for massive galaxies in the BOSS CMASS sample. Methods. We use grizy photometry from HSC to obtain Sérsic fits and stellar masses of CMASS galaxies for which HSC weak lensing data is available, visually selected to have spheroidal morphology. We apply a cut in stellar mass, $\log{M_*/M_\odot} > 11.0$,selecting $\sim$10, 000 objects. Using a Bayesian hierarchical inference method, we first investigate the distribution of Sérsic index and size as a function of stellar mass. Then, making use of shear measurements from HSC, we measure the distribution of halo mass as a function of stellar mass, size and Sérsic index. Results. Our data reveals a steep stellar mass-size relation $R_e \propto M_*^{β_R}$, with $β_R$ larger than unity, and a positive correlation between Sérsic index and stellar mass: $n \propto M_*^{0.46}$. Halo mass scales approximately with the 1.7 power of the stellar mass. We do not find evidence for an additional dependence of halo mass on size or Sérsic index at fixed stellar mass. Conclusions. Our results disfavour galaxy evolution models that predict significant differences in the size growth efficiency of galaxies living in low and high mass halos.
연구 동기 및 목표
- 대규모 CMASS 은하에서 어둠성 물질 허브 질량이 항성 질량, 크기, 세르시크 지수에 어떻게 관련되어 있는지 규명하는 것.
- 저질량 허브와 고질량 허브에서 크기 성장 효율이 다를 것으로 예측하는 은하 진화 모델을 테스트하는 것.
- 깊은 HSC 강성 사진 및 약한 렌즈 데이터를 기반으로 베이지안 계층적 추론을 적용하여 허브 질량 측정의 정확도를 향상시키는 것.
- 약 10,000개의 시각적으로 선별된 구형 CMASS 은하 샘플에서 항성 질량-크기-세르시크 지수 관계를 조사하는 것. 이 샘플의 $ \log M_* / M_\odot > 11.0 $.
제안 방법
- HSC $grizy$ 강성 사진에서 세르시크 지수, 반광도 반경, 항성 질량의 연합 분포를 모델링하기 위해 베이지안 계층적 추론을 적용하였다.
- 은하 빛 분포를 모델링하고 항성 질량 및 크기를 유도하기 위해 세르시크 및 세르시크-지수합성(serExp) 프로파일 피팅을 사용하였다.
- HSC에서의 약한 렌즈 시선 측정을 조합하여 CMASS 은하 주변 어둠성 물질 허브 질량 분포를 추론하였다.
- 측정 불확실성을 고려하여 스택드 약한 렌즈 분석을 수행하여 항성 질량, 크기, 세르시크 지수에 따른 허브 질량를 측정하였다.
- 허브 질량 추론에 대한 체계적 영향을 평가하기 위해 세르시크 모델과 serExp 모델 간의 결과를 비교하였다.
- 평탄한 $ \Lambda $CDM 우주론을 사용하였으며, $ \Omega_M = 0.3 $, $ H_0 = 70 \, \text{km} \, \text{s}^{-1} \, \text{Mpc}^{-1} $.
실험 결과
연구 질문
- RQ1CMASS 은하의 항성 질량-크기 관계는 세르시크 지수에 어떻게 의존하는가?
- RQ2고정된 항성 질량에서 허브 질량과 은하 크기 사이에 유의미한 상관관계가 있는가?
- RQ3CMASS 은하의 세르시크 지수는 항성 질량과 상관관계가 있으며, 이는 허브 질량 스케일링에 어떤 영향을 미치는가?
- RQ4다른 표면 밝기 프로파일 모델(세르시크 대비 serExp)이 허브 질량 분포 추론에 얼마나 큰 영향을 미치는가?
- RQ5약한 렌즈 기반의 허브 질량 추정치는 CMASS 샘플에서 은하 군집 측정치와 어떻게 비교되는가?
주요 결과
- CMASS 은하의 항성 질량-크기 관계는 매우 급격하며, $ R_e \propto M_*^{\beta_R} $로 표현되며, $ \beta_R > 1 $이므로 질량에 따른 강한 크기 진화를 나타낸다.
- 세르시크 지수는 항성 질량에 따라 $ n \propto M_*^{0.46} $로 증가하며, 고정된 항성 질량에서 크기는 세르시크 지수와 정적 상관관계를 보인다.
- 허브 질량는 항성 질량에 따라 $ M_{\text{halo}} \propto M_*^{1.7} $로 스케일링되며, 강한 비선형 스케일링임을 나타낸다.
- 고정된 항성 질량에서 허브 질량가 크기나 세르시크 지수에 유의미한 의존성이 없음을 확인하여, 고질량 허브에서 크기 성장이 더 효율적일 가능성은 낮다.
- 약한 렌즈와 군집 기반 허브 질량 추정치 사이의 0.2–0.3 디엑스의 격리는 광학 모델링 및 표면 밝기 프로파일 가정의 차이 때문일 가능성이 높다.
- 특히 세르시크와 serExp 모델 간의 큰 반경에서의 표면 밝기 프로파일 외삽에 기인한 체계적 불확실성은 향후 고정밀 측정에 있어 주요 과제이다.
더 나은 연구,지금 바로 시작하세요
논문 읽기부터 검토까지, 연구 시간을 획기적으로 줄여보세요.
카드 등록 없음 · 무료 플랜 제공
이 리뷰는 AI가 만들고, 인간 에디터가 검토했습니다.