
[논문 리뷰] Automating LC-MS/MS mass chromatogram quantification. Wavelet transform based peak detection and automated estimation of peak boundaries and signal-to-noise ratio using signal processing methods
이 논문은 액체 크로마토그래피-질량분석법/질량분석법(LC-MS/MS) 크로마토그램에서 자동 피크 검출, 경계 추정 및 신호 대 잡음비(SNR) 계산을 위한 웨이블릿 변환 기반 알고리즘을 제시한다. 연속 웨이블릿 변환과 디지털 신호 처리를 적용함으로써, 전문가의 수작업 정량과 높은 상관성을 확보하고, 비검출 결과를 감소시키며, 머리카락 샘플 내 6종의 스테로이드 호르몬에 대한 신뢰성 있고 객관적이며 재현 가능한 정량을 가능하게 한다.
While there are many different methods for peak detection, no automatic methods for marking peak boundaries to calculate area under the curve (AUC) and signal-to-noise ratio (SNR) estimation exist. An algorithm for the automation of liquid chromatography tandem mass spectrometry (LC-MS/MS) mass chromatogram quantification was developed and validated. Continuous wavelet transformation and other digital signal processing methods were used in a multi-step procedure to calculate concentrations of six different analytes. To evaluate the performance of the algorithm, the results of the manual quantification of 446 hair samples with 6 different steroid hormones by two experts were compared to the algorithm results. The proposed approach of automating mass chromatogram quantification is reliable and valid. The algorithm returns less nondetectables than human raters. Based on signal to noise ratio, human non-detectables could be correctly classified with a diagnostic performance of AUC = 0.95. The algorithm presented here allows fast, automated, reliable, and valid computational peak detection and quantification in LC- MS/MS.
연구 동기 및 목표
- 수작업 피크 경계 표기 및 SNR 추정을 제거하는 오픈소스 자동화된 LC-MS/MS 피크 정량 방법을 개발한다.
- 시간 소모적인 수작업 피크 통합을 알고리즘 처리로 대체하여 LC-MS/MS 데이터 분석의 생산성과 객관성을 향상시킨다.
- 실제 머리카락 샘플 분석에서 6종의 스테로이드 호르몬에 대해 전문가 수작업 평가자와의 성능을 검증한다.
- 수작업 전문가 정량과 비교하여 알고리즘의 신뢰성, 일관성 및 타당성을 평가한다.
- 비검출 결과를 분류하는 데 있어 SNR 및 피크 면적 하의 곡선(AUC)의 진단 성능을 평가한다.
제안 방법
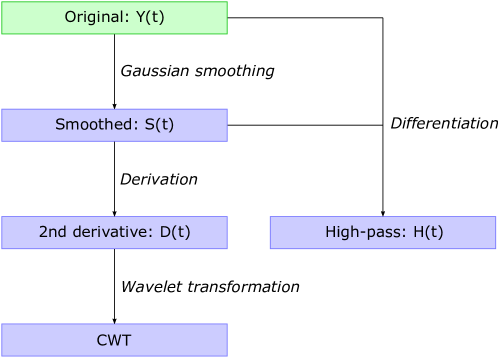
- 알고리즘은 시간-시리즈 강도 데이터를 분석하여 LC-MS/MS 크로마토그램의 피크 특징을 탐지하기 위해 연속 웨이블릿 변환(CWT)을 사용한다.
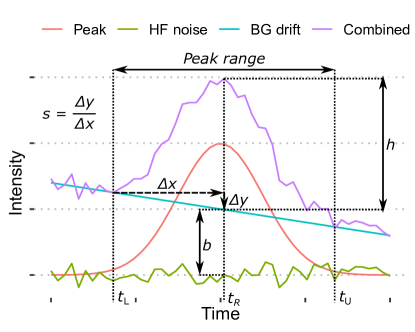
- 다단계 신호 처리 파이프라인은 가우시안 스무딩, 고역통과 필터링, 두 번째 도함수 근사 및 CWT를 포함하여 크로마토그래픽 신호를 배경, 피크 및 잡음 성분으로 분해한다.
- 피크 경계는 전문가 평가자의 행동을 모방하는 부분 볼록 껍질 방법을 사용하여 추정되며, 이는 AUC 계산 정확도를 향상시킨다.
- 신호 대 잡음비(SNR)는 피크 높이와 배경 잡음 기반으로 계산되어 저강도 또는 비검출 신호의 자동 탐지가 가능하다.
- 유지 시간 이동 및 드리프트를 고려하기 위해 배경을 선형 추세로 모델링하고 기준 물질에 대한 校정을 적용한다.
- 잠재변수 모델링(상태-특성 이론)을 사용하여 분산을 신뢰성, 특이성 및 일관성 성분으로 분해하여 방법 비교를 수행한다.
실험 결과
연구 질문
- RQ1자동화된 알고리즘이 전문가 수작업 정량과 강한 상관성을 보이는 분석물 농도를 생성하는가?
- RQ2정확도를 유지하면서 인간 평가자보다 비검출 결과의 수를 줄일 수 있는가?
- RQ3신호 대 잡음비(SNR) 및 피크 AUC는 높은 진단 성능으로 비검출 결과를 효과적으로 분류할 수 있는가?
- RQ4여러 분석물에 걸쳐 알고리즘의 신뢰성과 일관성은 전문가 수작업 평가자와 비교하여 어떻게 되는가?
- RQ5잠재변수 모델링을 통해 알고리즘이 인간 평가자와 동일한 생물학적 구조(호르몬 농도)를 측정하는가?
주요 결과
- 알고리즘은 전문가 수작업 정량과 강한 상관성을 보였으며, 분석물에 따라 신뢰도 값은 0.776에서 0.986 사이로 변동하였다.
- 알고리즘이 인간 평가자보다 유의미하게 더 적은 비검출 결과를 생성하여 저농도 신호 탐지의 감도 향상을 보였다.
- 신호 대 잡음비(SNR)와 피크 AUC는 비검출 결과 분류에 매우 효과적이었으며, 진단 성능에서 AUC 0.95를 달성하였다.
- 잠재변수 모델링을 통해 알고리즘이 인간 평가자와 동일한 구조(호르몬 농도)를 측정함을 확인하였으며, 높은 일관성과 신뢰성을 보였다.
- 코르티솔, 코르티존 및 DHEA에 대해서는 모델 적합도가 양호하였으며(RMSEA ≤ 0.059, SRMR ≤ 0.019), 테스토스테론과 프로게스테론에 대해서는 방법 특이적 및 복제 관련 잔차 공분산으로 인해 적합도가 열악하였다.
- 알고리즘의 일관성(0.801–0.869)과 신뢰도(0.959–0.986)는 특히 코르티솔과 DHEA에 대해 전문가 평가자와 유사하거나 이를 초월하였다.
더 나은 연구,지금 바로 시작하세요
논문 읽기부터 검토까지, 연구 시간을 획기적으로 줄여보세요.
카드 등록 없음 · 무료 플랜 제공
이 리뷰는 AI가 만들고, 인간 에디터가 검토했습니다.