
[논문 리뷰] Dwarf galaxies imply dark matter is heavier than $\mathbf{2.2 imes 10^{-21}} \, \mathbf{eV}$
이 논문은 밀려난 은하의 난방된 별 운동을 분석하여, 모델에 종속되지 않는 어두운 물질(DM) 입자 질량의 엄밀한 하한을 설정한다. 레오 II의 별 운동을 분석하여, DM 파동함수의 자기 일관된 재구성과 최대 평균 차이(MMD)를 통한 통계적 비교를 통해, 95% 신뢰수준에서 $ m > 2.2 \times 10^{-21} \, \text{eV} $를 도출하였다. 이는 천체물리학, 입자물리학, 동역학에 대한 가정 없이 도출된 것으로, 보존성 어두운 물질에 대한 현재까지 가장 강력한 기본 하한을 제시한다.
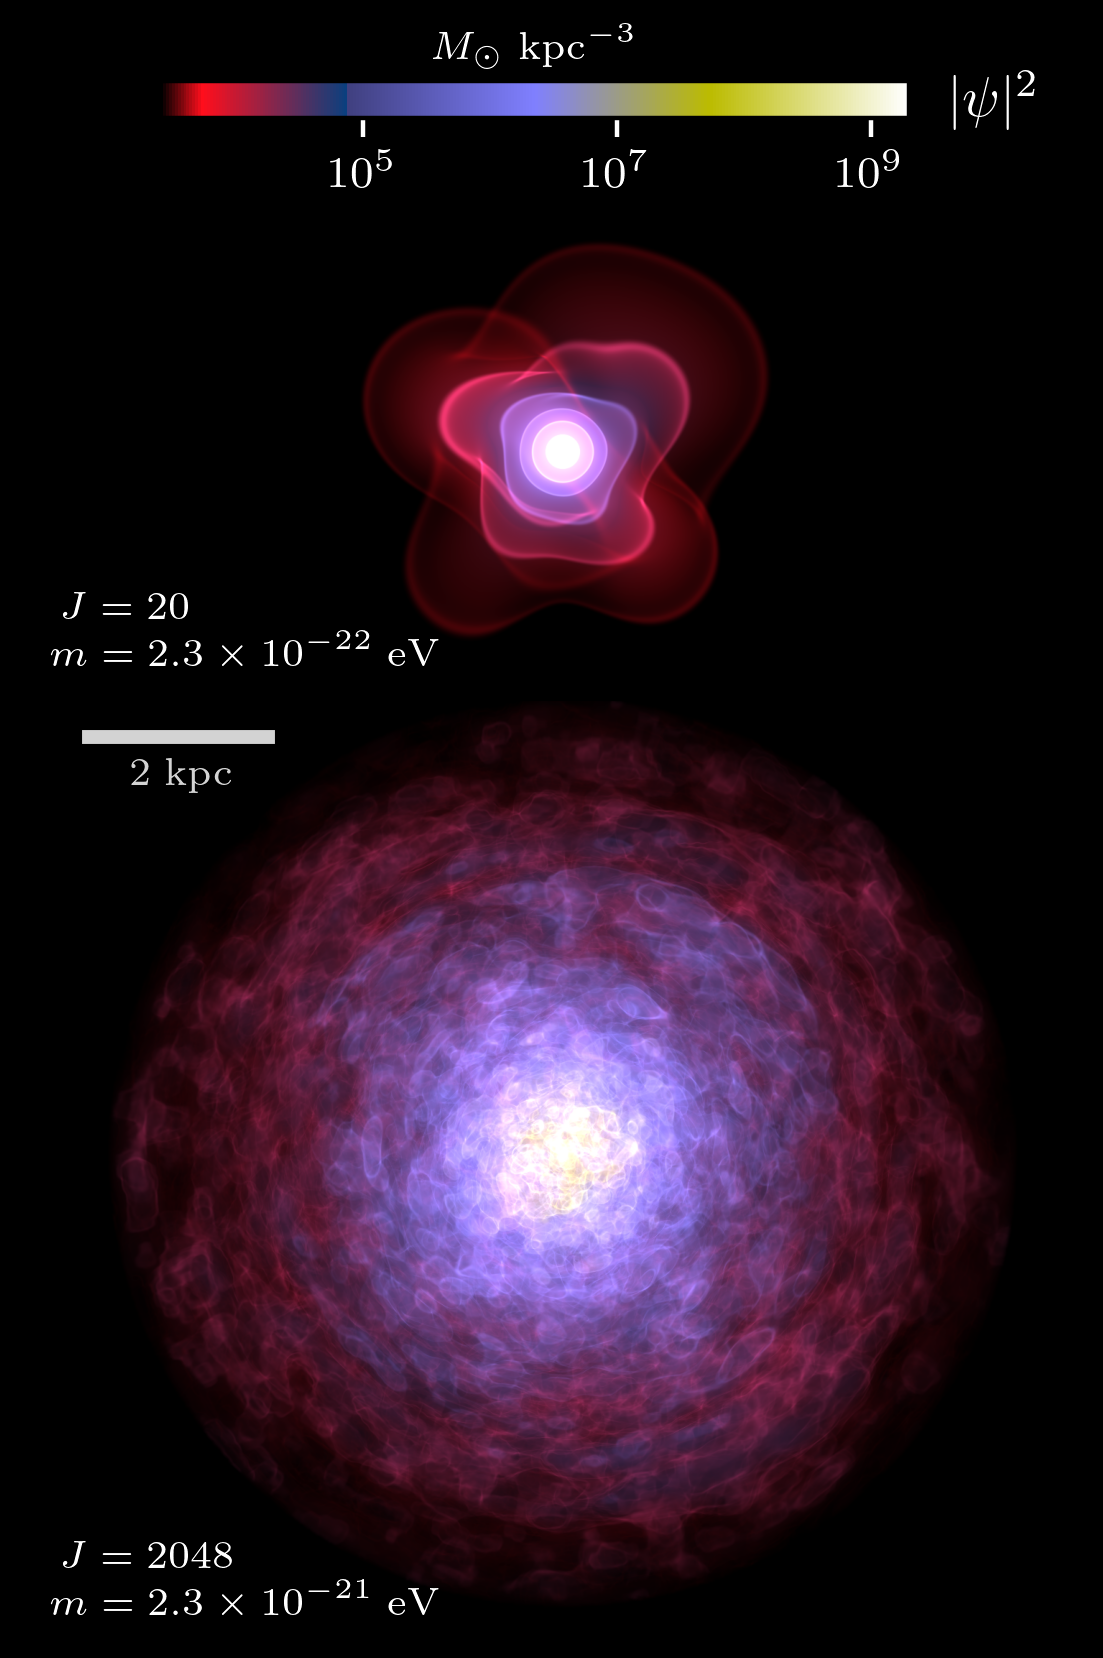
It is widely established that a lower bound on the dark matter particle mass, $m$, can be obtained by demanding that the de Broglie wavelength in a given galaxy must be smaller than the virial radius of the galaxy, leading to $m\gtrsim 10^{-22} ext{ eV}$ when applied to typical dwarf galaxies. This lower limit has never been derived precisely or rigorously. We use stellar kinematical data for the Milky Way satellite galaxy Leo II to self-consistently reconstruct a statistical ensemble of dark matter wavefunctions and corresponding density profiles. By comparison to a data-driven, model-independent reconstruction, and using a variant of the maximum mean discrepancy as a statistical measure, we determine that a self-consistent description of dark matter in the local Universe requires $m>2.2 imes 10^{-21}\,\mathrm{eV}\;\mathrm{(CL>95\%)}$. This lower limit is free of any assumptions pertaining to cosmology, microphysics (including spin), or dynamics of dark matter, and only assumes that it is predominantly composed of a single bosonic particle species.
연구 동기 및 목표
- 소형 타원은하의 운동 데이터를 이용하여 어두운 물질 입자 질량에 대한 기본 하한을 유도하기 위해.
- 데 브로이 파장의 간단한 추정에 의존하는 히어리틱한 '속임수' 한계를 넘어서기 위해.
- 천체물리학, 입자 스핀, 비선형 동역학에 대한 가정 없이도 통계적으로 신뢰할 수 있는 모델에 종속되지 않는 방법을 개발하기 위해.
- 단일 보존성 장으로서의 어두운 물질의 자기 일관된 기술이 레오 II의 관측된 별 운동을 재현할 수 있는지 테스트하기 위해.
- 핵-헤일로 관계, 복사 물리학, 장기적인 동역학적 진화에 영향을 받지 않는 하한을 설정하기 위해.
제안 방법
- 베이지안 추론 프레임워크를 사용하여 레오 II의 별 속도 분산 데이터로부터 5,000개의 어두운 물질 파동함수의 통계적 집합을 재구성하기 위해.
- 스체로딩어-포아송 시스템을 사용하여 보존성 어두운 물질 헬로의 자기 일관된 구형 대칭 정적인 상태를 모델링하기 위해.
- 파동함수로부터 구형 평균 밀도 프로파일 $ \langle |\psi|^2 \rangle $를 계산하여 데이터 기반의 모델에 종속되지 않는 재구성과 비교하기 위해.
- 예측된 밀도 프로파일과 관측된 밀도 프로파일을 비교하기 위해 최대 평균 차이(MMD)의 변종을 통계적 검정으로 사용하기 위해.
- 비모수적이고 커널 기반의 통계적 검정을 사용하여 파동함수 기반 모델이 관측과 일치하는 신뢰수준을 결정하기 위해.
- 다양한 어두운 물질 질량에 대한 체계적 스캔을 수행하여 95% 신뢰수준에서 데이터와 일치하는 최소 질량을 식별하기 위해.

실험 결과
연구 질문
- RQ1레오 II 소형 타원은하의 운동 데이터와 일치하는 어두운 물질 입자 질량의 최소값은 얼마인가?
- RQ2보존성 어두운 물질의 파동함수 기반 자기 일관된 모델이 특정 헬로 프로파일을 가정하지 않고 관측된 별 속도 분산 프로파일을 재현할 수 있는가?
- RQ3유도된 어두운 물질 질량 하한이 데 브로이 파장 고려에 기반한 기존의 히어리틱한 한계와 비교해 볼 때 어떻게 다른가?
- RQ4유도된 하한이 천체물리학 모델, 입자 스핀, 또는 복사 물리학에 얼마나 영향을 받지 않는가?
- RQ5파동함수 재구성의 통계적 일치도 가정된 어두운 물질 입자 질량에 따라 달라지는가?
주요 결과
- 분석 결과 95% 신뢰수준에서 $ m > 2.2 \times 10^{-21} \, \text{eV} $의 하한이 확립되었으며, 일반적으로 언급되는 $ \sim 10^{-22} \, \text{eV} $의 속임수 한계보다 훨씬 강력하다.
- 천체물리학, 입자물리학(스핀 포함), 비선형 동역학에 대한 가정 없이 유도되었으며, 유일한 가정은 단일 보존성 입자 종류라는 점에서 신뢰할 수 있다.
- 핵-헤일로 관계의 불확실성에 강건하며, 별의 가열과 같은 복사 효과로 인해 다른 모델에서 코어형 프로파일이 변할 수 있는 것과는 달리 영향을 받지 않는다.
- 최대 평균 차이(MMD)를 사용한 통계적 검정은 $ m \leq 2.2 \times 10^{-21} \, \text{eV} $인 파동함수들이 95% 신뢰수준에서 관측 데이터와 일치하지 않음을 확인했다.
- 스핀-0 및 고차 스핀 보존성 어두운 물질 모두에 대해 결과가 유효하며, 구형 평균 밀도 프로파일은 극화 상태에 영향을 받지 않기 때문이다.
- 리만-알파 숲, 은하 수세기, 에리다누스 II의 동역학적 가열에 기반한 이전의 한계보다 더 강력한 하한을 제공한다. 이는 추가적인 천체물리학 모델링이 필요로 한다.
더 나은 연구,지금 바로 시작하세요
논문 읽기부터 검토까지, 연구 시간을 획기적으로 줄여보세요.
카드 등록 없음 · 무료 플랜 제공
이 리뷰는 AI가 만들고, 인간 에디터가 검토했습니다.