
[논문 리뷰] GALACTICNUCLEUS: A high-angular-resolution JHKs imaging survey of the Galactic centre III. Evidence for wavelength dependence of the extinction curve in the near-infrared
이 연구는 GALACTICNUCLEUS 조사에서 확보한 165,000여 명의 적색 클럽 항성에 대한 고각해상도 JHKs 광도계를 활용하여 은하 중심의 근적외선 투과도 곡선을 분석한다. 파장에 따라 변하는 투과도 지수에 대한 강력한 증거를 제시하며, α_JH = 2.44 ± 0.05 및 α_HKs = 2.23 ± 0.05로 나타내어 짧은 파장에서 더 급격한 투과도를 보이며, 선로 방향이나 절대 투과도에 따른 유의미한 변동은 발견되지 않는다.
The characterisation of the extinction curve in the near infrared (NIR) is fundamental to analyse the structure and stellar population of the Galactic centre (GC), whose analysis is hampered by the extreme interstellar extinction ($A_V\sim 30$ mag) that varies on arc-second scales. Recent studies indicate that the behaviour of the extinction curve might be more complex than previously assumed, pointing towards a variation of the extinction curve as a function of wavelength. We aim at analysing the variations of the extinction index, $α$, with wavelength, line-of-sight, and absolute extinction, extending previous analysis to a larger area of the innermost regions of the Galaxy. We analysed the whole GALACTICNUCLEUS survey, a high-angular resolution ($\sim 0.2''$) $JHK_s$ NIR survey specially designed to observe the GC in unprecedented detail. It covers a region of $\sim 6000$\,pc$^2$, comprising fields in the nuclear stellar disc, the inner bulge, and the transition region between them. We applied two independent methods based on red clump (RC) stars to constrain the extinction curve and analysed its variation superseding previous studies. We used more than 165,000 RC stars and increased significantly the size of the regions analysed to confirm that the extinction curve varies with the wavelength. We estimated a difference $Δα= 0.21\pm0.07$ between the obtained extinction indices, $α_{JH}=2.44\pm0.05$ and $α_{HK_s} = 2.23\pm0.05$. We also concluded that there is no significant variation of the extinction curve with wavelength, with the line-of-sight or the absolute extinction. Finally, we computed the ratios between extinctions, $A_J/A_H = 1.87\pm0.03$ and $A_{H}/A_{K_s} = 1.84\pm0.03$, consistent with all the regions of the GALACTICNUCLEUS catalogue.
연구 동기 및 목표
- 은하 중심에서 극도로 높은 투과도(AV ~ 30 mag)로 인해 항성 집단 및 구조 분석이 복잡해지는 상황에서 근적외선 투과도 곡선을 특성화하는 것.
- 투과도 지수 α가 파장, 선로 방향, 또는 절대 투과도에 따라 변하는지 조사하여 단일 거듭제곱 법칙 투과도 곡선을 가정하는 것에 도전하는 것.
- 잘 정의된 내재 색상이 있는 표준 캔들로서의 적색 클럽 항성을 활용하여 밴드폭 광도계의 혼동을 해결하는 것.
- 파장 의존성 투과도 효과를 정량화하여 내측 은하 영역에서의 투과도 측정 정확도와 항성 거리 추정치를 향상시키는 것.
제안 방법
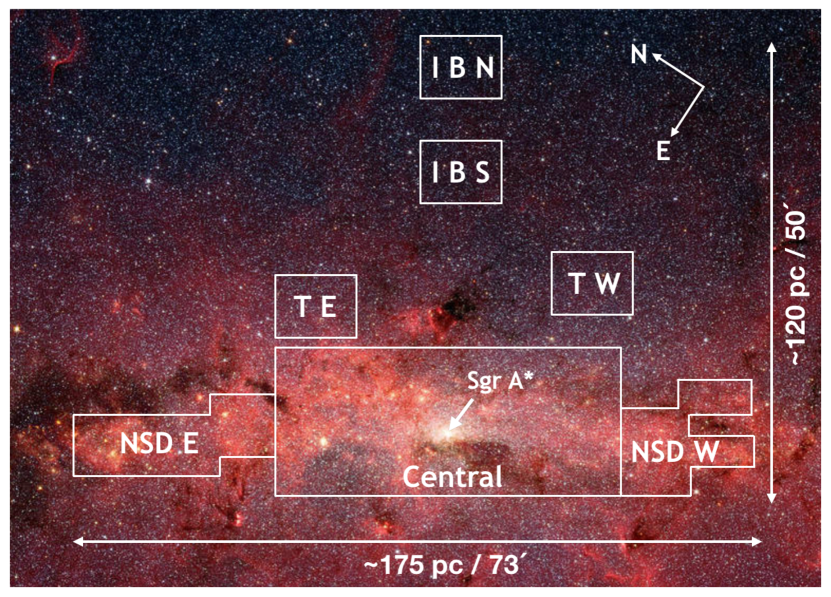
- 핵성별성, 내부 부두 및 전이 영역을 커버하는 약 6000 pc²의 영역에서 고각해상도(≈0.2") JHKs 이미징 데이터를 GALACTICNUCLEUS 조사에서 확보.
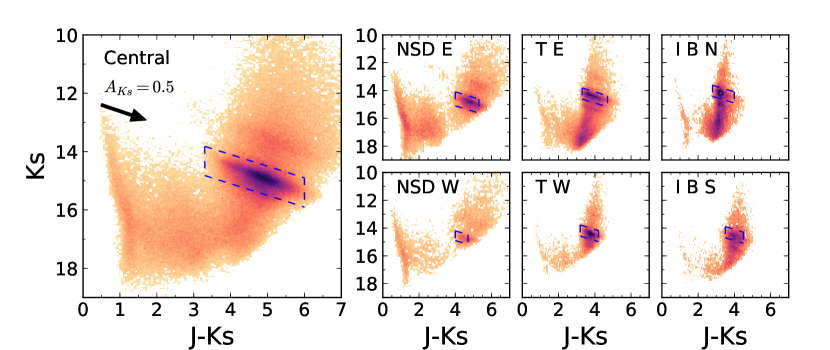
- 색도-등급도를 활용하여 165,000여 명 이상의 적색 클럽 항성을 식별하여 내재된 J−H 및 H−Ks 색상이 잘 정의된 표준 캔들로 활용.
- 관측된 JHKs 등급에 Aλ ∝ λ^−α를 적합하여 투과도 지수 α를 도출하기 위해 두 가지 독립적인 방법을 적용하고, 차등 투과도를 보정.
- 각 영역 및 항성 유형의 효과적 파장(λ_eff)을 계산하여 광도계의 혼동을 최소화하고, 각 필드의 평균 절대 투과도를 사용.
- 오차를 제곱합으로 전파하고, 외부 투과도 모델(Schlafly & Finkbeiner 2016, Nishiyama et al. 2009 등)과 교차 검증.
- 선로 방향 및 투과도 수준 의존성을 평가하기 위해 다양한 영역과 투과도 수준에서 α 값을 비교하며, 저품질의 NSD W 영역은 제외.
실험 결과
연구 질문
- RQ1은하 중심에서 근적외선 투과도 지수 α가 파장에 따라 변하는가? 이는 표준 거듭제곱 법칙 가정에 도전하는가?
- RQ2내측 은하 영역에서 투과도 곡선이 선로 방향 또는 절대 투과도 수준에 따라 의존하는가?
- RQ3적색 클럽 항성이 항성 유형의 혼동으로부터 자유로운 강력한 체계적 방법으로 파장 의존성 투과도를 측정할 수 있는가?
- RQ4유도된 투과도 비율 A_J/A_H 및 A_H/A_Ks는 표준 모델과 어떻게 비교되며, 이는 투과도 곡선의 형태에 어떤 함의를 갖는가?
- RQ5밴드폭 필터에서의 비선형 광도계 효과가 투과도 곡선 측정을 어떻게 편향시키는가? 이는 큰 균일한 RC 항성 샘플을 활용하여 완화될 수 있는가?
주요 결과
- 투과도 지수 α는 유의미한 파장 의존성을 보이며, α_JH = 2.44 ± 0.05 및 α_HKs = 2.23 ± 0.05로 나타나 Δα = 0.21 ± 0.07의 차이를 보인다.
- 모든 영역에서 투과도 비율이 일관되며, A_J/A_H = 1.87 ± 0.03 및 A_H/A_Ks = 1.84 ± 0.03로 나타나 투과도 곡선의 비균일한 형태를 지지한다.
- 선로 방향이나 절대 투과도에 따른 α의 유의미한 변동은 발견되지 않아, 조사된 영역 내에서 투과도 곡선이 공간적으로 불변임을 나타낸다.
- 관측된 α의 파장 의존성은 체계적 오차나 혼동으로 인한 것이 아니며, 외부 모델과의 교차 검증 및 다른 방법으로 확인되어 강인함을 입증한다.
- 이전 연구에서 절대 투과도에 따라 α가 변한다는 주장은 방법론적 편향과 NSD 영역 내 항성 거리 혼합으로 인한 것으로 밝혀졌으며, 이는 잘못된 결론이었다.
- 단일 거듭제곱 법칙 투과도 곡선을 가정할 경우, 거리 및 항성 집단 분석에서 상당한 편향(예: 약 0.3 mag의 투과도 오차)을 초래할 수 있으며, 이는 파장 의존성 보정이 필요함을 시사한다.
더 나은 연구,지금 바로 시작하세요
논문 읽기부터 검토까지, 연구 시간을 획기적으로 줄여보세요.
카드 등록 없음 · 무료 플랜 제공
이 리뷰는 AI가 만들고, 인간 에디터가 검토했습니다.