[논문 리뷰] Open data from the third observing run of LIGO, Virgo, KAGRA and GEO
이 논문은 LIGO, Virgo, KAGRA 및 GEO의 세 번째 관측 주기 O3의 오픈 데이터 공개를 발표합니다.
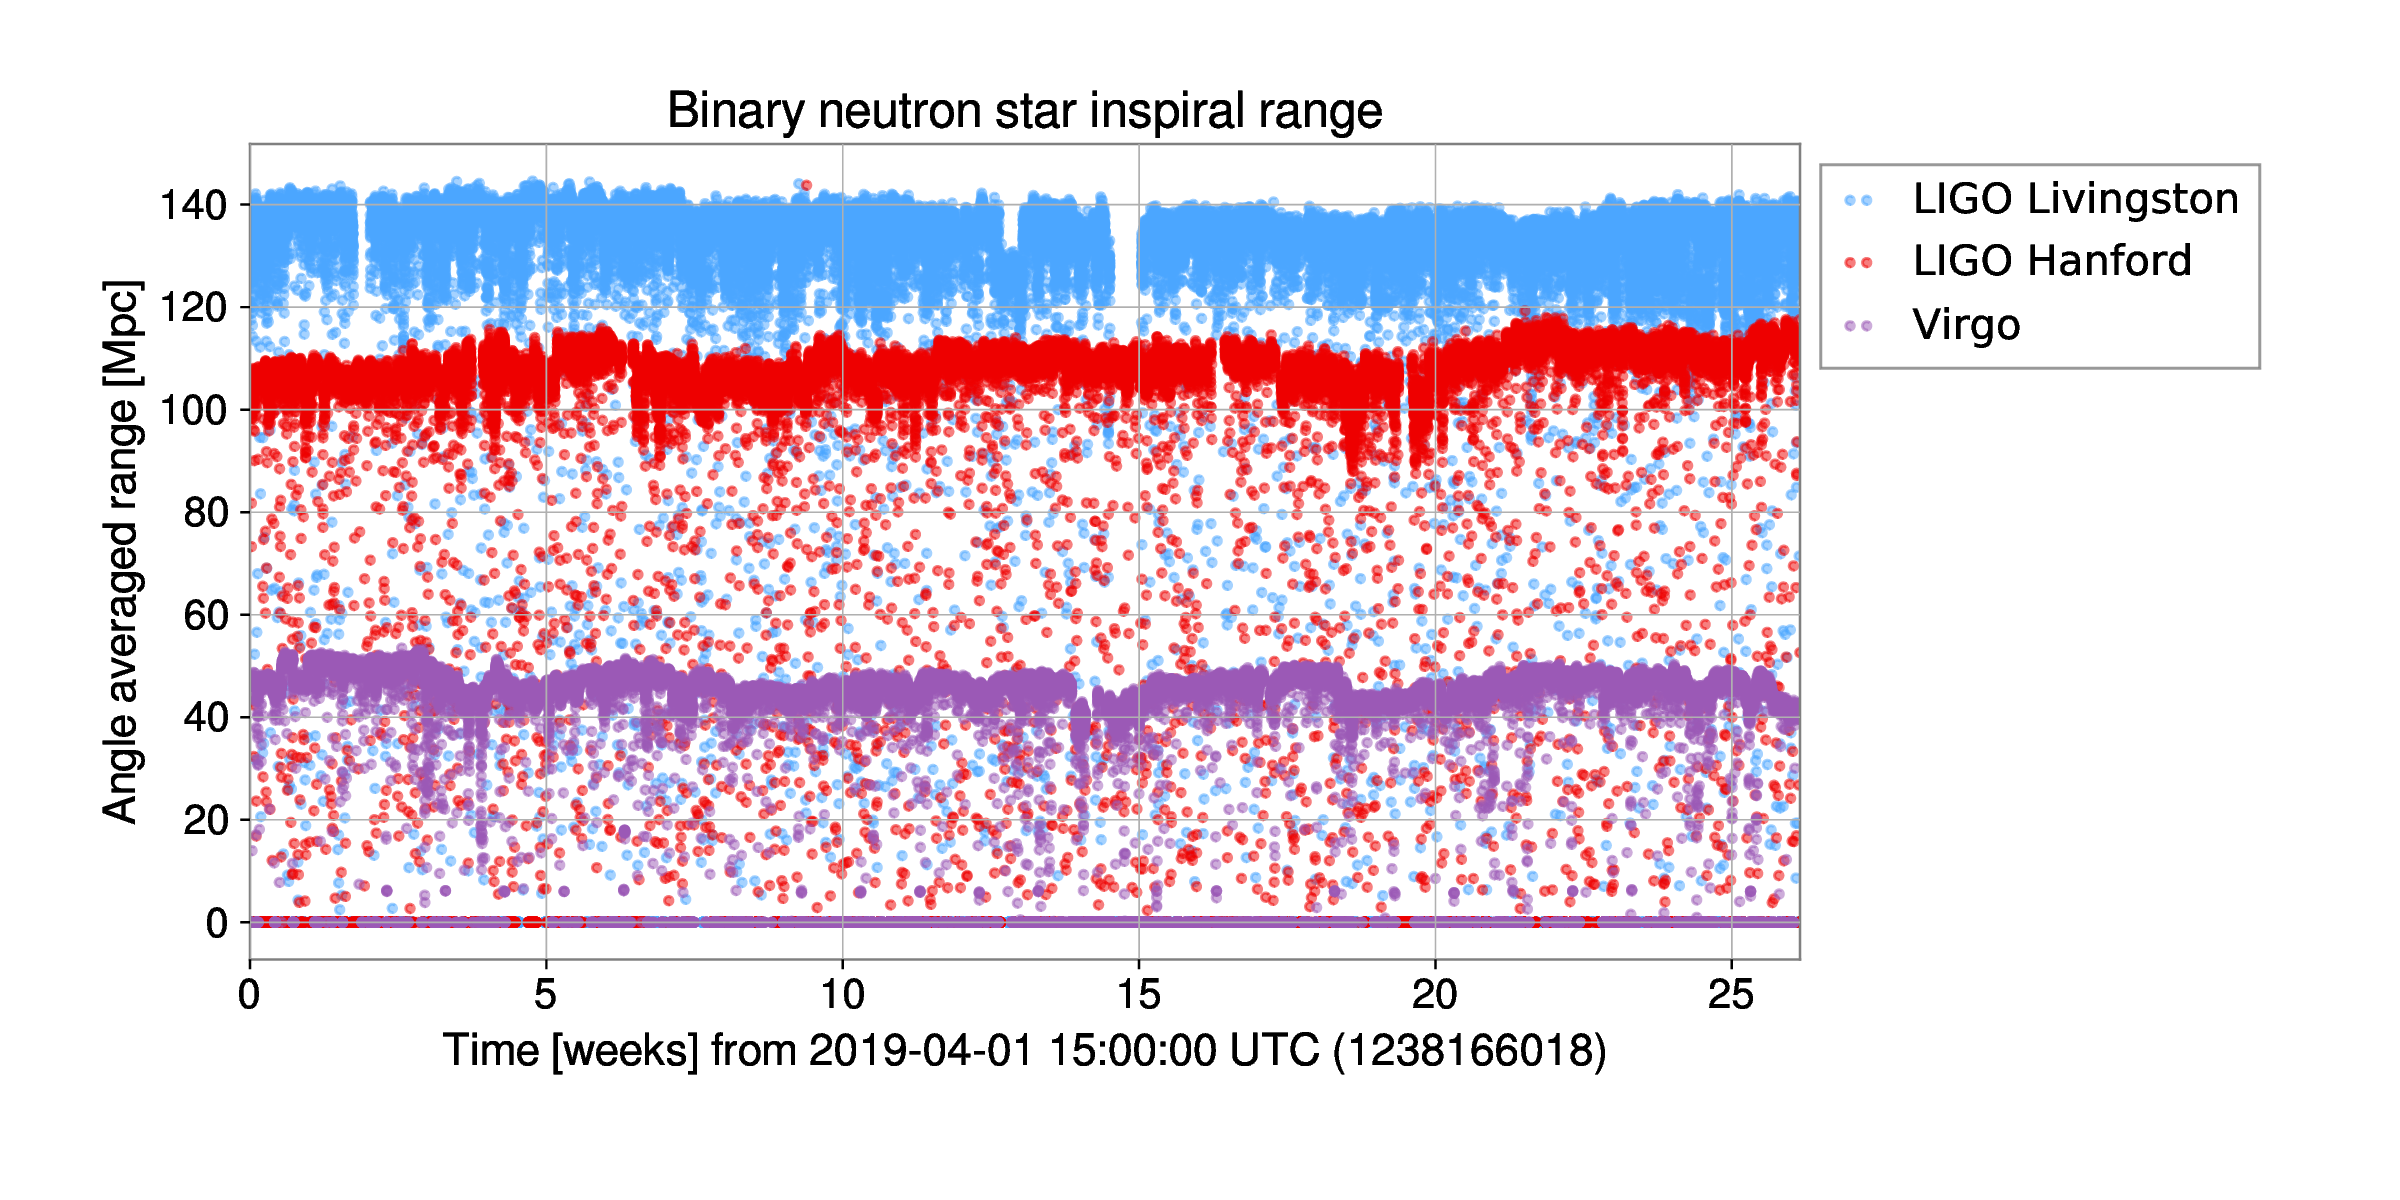
The global network of gravitational-wave observatories now includes five detectors, namely LIGO Hanford, LIGO Livingston, Virgo, KAGRA, and GEO 600. These detectors collected data during their third observing run, O3, composed of three phases: O3a starting in April of 2019 and lasting six months, O3b starting in November of 2019 and lasting five months, and O3GK starting in April of 2020 and lasting 2 weeks. In this paper we describe these data and various other science products that can be freely accessed through the Gravitational Wave Open Science Center at https://gwosc.org. The main dataset, consisting of the gravitational-wave strain time series that contains the astrophysical signals, is released together with supporting data useful for their analysis and documentation, tutorials, as well as analysis software packages.
연구 동기 및 목표
- LIGO, Virgo, KAGRA 및 GEO의 세 번째 관측 주기(O3)의 오픈 데이터 공개를 설명한다.
- 공개와 함께 제공되는 데이터 제품, 형식 및 메타데이터를 요약한다.
- 사용자 참여를 촉진하기 위한 접속 절차와 이용 지침을 설명한다.
- 공개와 관련된 협력, 데이터 품질 및 보정 정보를 강조한다.
제안 방법
- O3에서 공개된 데이터 제품을 식별하고 분류한다.
- 공개에 포함된 데이터 형식, 보정 메타데이터 및 품질 플래그를 개요한다.
- 데이터 검색을 위한 접근 인터페이스, 문서화 및 API나 포털을 설명한다.
- 공개 데이터의 거버넌스, 라이선스 및 인용 관행을 요약한다.
실험 결과
연구 질문
- RQ1O3 오픈 데이터 공개에 포함된 데이터 제품은 무엇인가?
- RQ2연구자들이 O3 데이터 및 관련 메타데이터에 어떻게 접근하고 활용할 수 있는가?

더 나은 연구,지금 바로 시작하세요
연구 설계부터 논문 작성까지, 연구 시간을 획기적으로 줄여보세요.
카드 등록 없음 · 무료 플랜 제공
이 리뷰는 AI가 만들고, 인간 에디터가 검토했습니다.