
[논문 리뷰] Optical Cluster Cosmology with SDSS redMaPPer clusters and HSC-Y3 lensing measurements
이 논문은 SDSS redMaPPer 카탈로그와 HSC-Y3 약한 렌즈 데이터를 사용하여 은하 클러스터에 대한 빈, 동시 우주론적 분석을 제시한다. 전면 모델링 접근법을 사용하여 비등방성 보정 효과와 복사역학적 피드백을 고려한다. 분석 결과 $ S_8 = 0.816^{+0.041}_{-0.039} $로 강력한 제약을 도출하였으며, 이는 CMB 및 대규모 구조 결과와 일치하며, 정보성 사전 분포 없이 편향 없는 우주론적 제약을 제공함을 보여준다.
We present cosmology results obtained from a blind joint analysis of the abundance, projected clustering, and weak lensing of galaxy clusters measured from the Sloan Digital Sky Survey (SDSS) redMaPPer cluster catalog and the Hyper-Suprime Cam (HSC) Year3 shape catalog. We present a full-forward model for the cluster observables, which includes empirical modeling for the anisotropic boosts on the lensing and clustering signals of optical clusters. We validate our analysis via mock cluster catalogs which include observational systematics, such as the projection effect and the effect of baryonic feedback, and find that our analysis can robustly constrain cosmological parameters in an unbiased manner without any informative priors on our model parameters. The joint analysis of our observables in the context of the flat $Λ$CDM model results in cosmological constraints for $S_8\equiv σ_8 \sqrt{Ω_{ m m} / 0.3}=0.816^{+0.041}_{-0.039}$. Our result is consistent with the $S_8$ inference from other cosmic microwave background- and large scale structure-based cosmology analyses, including the result from the \emph{Planck} 2018 primary CMB analysis.
연구 동기 및 목표
- 광학 클러스터를 이용하여 클러스터 수밀도, 투사된 군집, 약한 렌즈 신호의 빈, 동시 분석을 수행하여 우주론적 파라미터를 제약하는 것.
- 선형 방향 투사 효과와 필라멘트 구조로 인한 렌즈 및 군집 신호의 비등방성 보정을 모델링하고 보정하는 것.
- 투사 효과와 복사역학적 피드백과 같은 관측 시스템적 오차를 포함한 현실적인 모의 카탈로그를 사용하여 분석 파이프라인의 유효성을 검증하는 것.
- 모델 파라미터에 대한 정보성 사전 분포 없이 편향 없는 우주론적 제약을 달성하는 것.
- 수밀도와 렌즈 데이터를 이용한 광학 클러스터 우주론의 자가교정 프레임워크를 제공하는 것.
제안 방법
- 전면 모델링 접근법을 사용하여 빈도, 투사 군집, 약한 렌즈 신호를 포함한 클러스터 관측량을 시뮬레이션한다.
- 선형 방향 투사 효과와 필라멘트 정렬로 인한 렌즈 및 군집 신호의 비등방성 보정을 경험적 모델링으로 통합한다.
- 투사 효과와 복사역학적 피드백을 포함한 현실적인 시스템적 오차를 가진 모의 데이터를 생성하여 분석의 강건성을 시험한다.
- 우주론적 제약을 정보성 사전 분포 없이 도출하기 위해 빈 방식으로 분석을 수행한다.
- 평탄한 $\Lambda$CDM 모델을 기준 우주론으로 사용하며, 주요 우주론적 제약로 $S_8 = \sigma_8 \sqrt{\Omega_{\rm m}/0.3}$를 사용한다.
- Markov Chain Monte Carlo 방법을 사용하여 $S_8$ 및 질량-관측량 관계에 대한 사후 분포 샘플링을 수행한다.
실험 결과
연구 질문
- RQ1클러스터 수밀도, 군집, 약한 렌즈의 빈 동시 분석이 정보성 사전 분포 없이 편향 없는 우주론적 제약을 도출할 수 있는가?
- RQ2투사 효과와 필라멘트 구조는 광학 클러스터의 렌즈 및 군집 신호에 비등방성 보정을 어떻게 유도하는가?
- RQ3복사역학적 피드백과 관측 시스템적 오차는 광학 클러스터 설문 조사에서 우주론적 추론에 얼마나 큰 영향을 미치는가?
- RQ4이 광학 클러스터 분석에서 도출된 $S_8$ 제약은 CMB 및 대규모 구조 탐사 결과와 일치하는가?
- RQ5전면 모델링 접근법은 체계적인 오차를 강력하게 반영하고 신뢰할 수 있는 우주론적 제약을 도출할 수 있는 자가교정 프레임워크를 제공하는가?
주요 결과
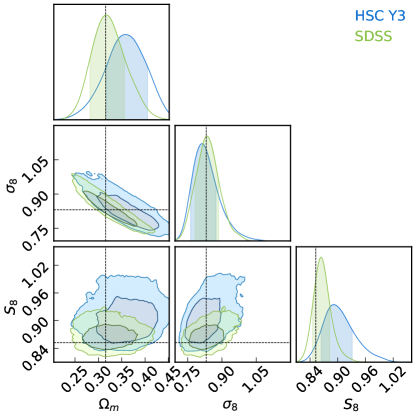
- 동시 분석 결과 $ S_8 = 0.816^{+0.041}_{-0.039} $로 도출되었으며, 이는 Planck 2018 및 다른 대규모 구조 결과와 일치한다.
- 모의 카탈로그를 통한 검증을 통해 투사 효과와 복사역학적 피드백과 같은 시스템적 오차에 대해 분석이 강건함을 입증하였다.
- 선형 방향 구조로 인한 렌즈 및 군집 신호의 비등방성 보정을 성공적으로 모델링하여 정확도를 향상시켰다.
- 빈 분석 프레임워크는 모델 파라미터에 대한 정보성 사전 분포 없이 편향 없는 제약을 도출하였다.
- 시스템적 오차가 적절히 모델링될 경우 광학 클러스터 우주론이 자가교정 가능한 우주론 탐사 방법으로 유의미함을 뒷받침한다.
- 광학적 클러스터 설문 조사가 약한 렌즈와 전면 모델링을 결합할 경우 경쟁 가능한 우주론적 제약을 도출할 수 있음을 시연하였다.
더 나은 연구,지금 바로 시작하세요
논문 읽기부터 검토까지, 연구 시간을 획기적으로 줄여보세요.
카드 등록 없음 · 무료 플랜 제공
이 리뷰는 AI가 만들고, 인간 에디터가 검토했습니다.