
[논문 리뷰] Performance of LHAASO-WCDA and Observation of Crab Nebula as a Standard Candle
이 논문은 테바 레이저 천문학에서의 표준 캔들로 사용되는 크래브 성운을 관측하여, 첫 번째 LHAASO 워터 체렌코프 검출기 어레이(WCDA-1)의 성능을 평가한다. 10개월 간의 데이터를 사용하여 WCDA-1는 5σ 유의수준에서 연간 65 mCU의 감도를 확보하였으며, 3 TeV 이상에서 <0.4°의 뛰어난 각도 해상도와 <0.05°의 정확한 지향성으로 설계 및 캘리브레이션을 검증하였다. 측정된 크래브 성운의 스펙트럼 에너지 분포(Spectral Energy Distribution, SED)는 0.5–15.8 TeV 범위에서 다른 주요 실험들과 양호한 일치를 보였다.
The first Water Cherenkov detector of the LHAASO experiment (WCDA-1) has been operating since April, 2019. The first 10 months of data have been analyzed to test its performance by observing the Crab Nebula as a standard candle. The WCDA-1 achieves the sensitivity of 65 mCU per year with a statistical threshold of 5 $σ$. In order to do so, 97.7\% cosmic ray background rejection rate around 1 TeV and 99.8\% around 6 TeV with an approximately photon acceptance about 50\% by using the $compactness$ of the shower footprints to be greater than 10 as the discriminator between gamma induced showers and the cosmic ray backgrounds. The angular resolution is measured using the Crab Nebula as a point source about 0.45$^\circ$ at 1 TeV and better than 0.2$^\circ$ above 6 TeV with the pointing accuracy better than 0.05$^\circ$. They are all matching the design specifications. The energy resolution is found 33\% for gamma rays around 6 TeV. The spectral energy distribution of the Crab Nebula in the range from 500 GeV and 15.8 TeV is measured and in agreement with results of other TeV gamma ray observatories.
연구 동기 및 목표
- TeV 감마선 천문학에서 크래브 성운을 표준 캔들로 사용하여 첫 번째 LHAASO 워터 체렌코프 검출기 어레이(WCDA-1)의 성능을 검증하는 것.
- 유명한 천체물리학적 천체를 장기간 관측하여 검출기의 감도, 각도 해상도 및 지향 정확도를 평가하는 것.
- 시뮬레이션 가정과 검출기 안정성으로 인한 감마선 에너지 재구성 및 수용률 추정의 체계적 불확실성 평가.
- 우주선 데이터를 사용하여 검출기 반응을 캘리브레이션하고 시뮬레이션 모델을 측정된 샤워 분포와 비교하여 검증하는 것.
- 0.5–15.8 TeV 범위에서 크래브 성운의 스펙트럼 에너지 분포(Spectral Energy Distribution, SED)를 측정하고 다른 주요 감마선 실험 결과와 비교하는 것.
제안 방법
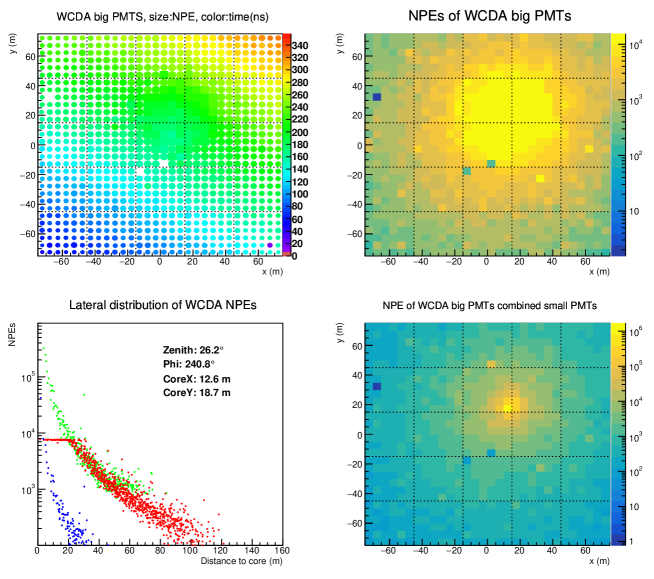
- WCDA-1는 2019년 4월부터 10개월 간의 데이터를 확보하였으며, 공기 샤워에서 발생하는 체렌코프 빛을 감지하기 위해 900개의 광전자 배율관(PMTs)을 사용하였다.
- 감마선 이벤트는 에너지 스케일 불확실성을 평가하기 위해 0.3 PE 및 0.6 PE의 임계값을 사용한 전하 기반 샤워 재구성 방법으로 재구성되었다.
- 검출기 방향 및 타이밍은 단위별 정밀 캘리브레이션을 통해 0.05° 이내의 지향 정확도와 3 TeV 이상에서 <0.4°의 각도 해상도를 확보하였다.
- 공기 샤워 및 검출기 시뮬레이션은 관측된 우주선 데이터와 일치하도록 조정되어, 유효 면적 및 감마선 수용률 추정이 가능해졌다.
- 체계적 불확실성은 두 가지 우주선 조성 가정을 사용하여 시뮬레이션 출력과 데이터를 비교하고, 히트 분포의 불일치를 분석함으로써 정량화되었다.
- 크래브 성운의 SED는 에너지 재구성 및 수용률 보정을 사용하여 재구성되었으며, 체계적 오차는 임계값 변화 및 모델 비교를 통해 추정되었다.

실험 결과
연구 질문
- RQ1WCDA-1는 테바 감마선을 탐지하는 데 어떤 감도를 보이며, 설계 사양을 충족하는가?
- RQ23 TeV 이상의 감마선 천체에 대해 WCDA-1의 각도 해상도와 지향 방향 정확도는 얼마나 정확한가?
- RQ3검출기 시뮬레이션, 우주선 조성, 샤워 모델링의 불확실성이 감마선 에너지 스케일과 수용률 추정에 얼마나 영향을 미치는가?
- RQ4WCDA-1에서 측정한 크래브 성운의 SED는 다른 주요 감마선 관측소 결과와 얼마나 일치하는가?
- RQ5170일간의 운영 기간 동안 검출기 안정성과 물 투명도 변화가 전하 측정 및 검출 효율성에 어떤 영향을 미치는가?
주요 결과
- WCDA-1는 5σ 유의수준에서 연간 65 mCU의 감도를 확보하였으며, 설계 사양과 일치하였다.
- 3 TeV 이상에서 감마선 도래 방향의 각도 해상도는 0.4° 이하이며, 지향 정확도는 0.05° 이하였다.
- 크래브 성운의 스펙트럼 에너지 분포(Spectral Energy Distribution, SED)는 0.5 TeV에서 15.8 TeV까지 측정되었으며, 다른 주요 감마선 실험들과 양호한 일치를 보였다.
- SED의 체계적 불확실성은 약 ${}^{+8}_{-24}$ %로 추정되었으며, 주로 샤워 시뮬레이션, 우주선 조성 및 에너지 스케일 캘리브레이션의 불확실성에 기인하였다.
- 시간이 지남에 따라 PMT 전하가 증가함에 따라 전하 측정에 11%의 보정을 적용하였으며, 저히트 이벤트에서 Q=0.3 PE일 경우 약 8.8%의 불확실성이 발생하였다.
- 두 가지 우주선 조성 가정 간의 히트 분포 모델링 불일치로 인해 검출기 효율 추정에 대해 보수적인 16%의 불확실성이 발생하였다.
더 나은 연구,지금 바로 시작하세요
논문 읽기부터 검토까지, 연구 시간을 획기적으로 줄여보세요.
카드 등록 없음 · 무료 플랜 제공
이 리뷰는 AI가 만들고, 인간 에디터가 검토했습니다.