[논문 리뷰] RAGBench: Explainable Benchmark for Retrieval-Augmented Generation Systems
RAGBench는 다중 도메인에서 RAG 시스템을 평가하기 위한 Ground-truth 주석이 포함된 대규모 100k 샘플 벤치마크와 TRACe 평가 프레임워크(Utilization, Relevance, Adherence, Completeness)를 도입하여 다중 도메인에서 RAG 시스템을 평가합니다.
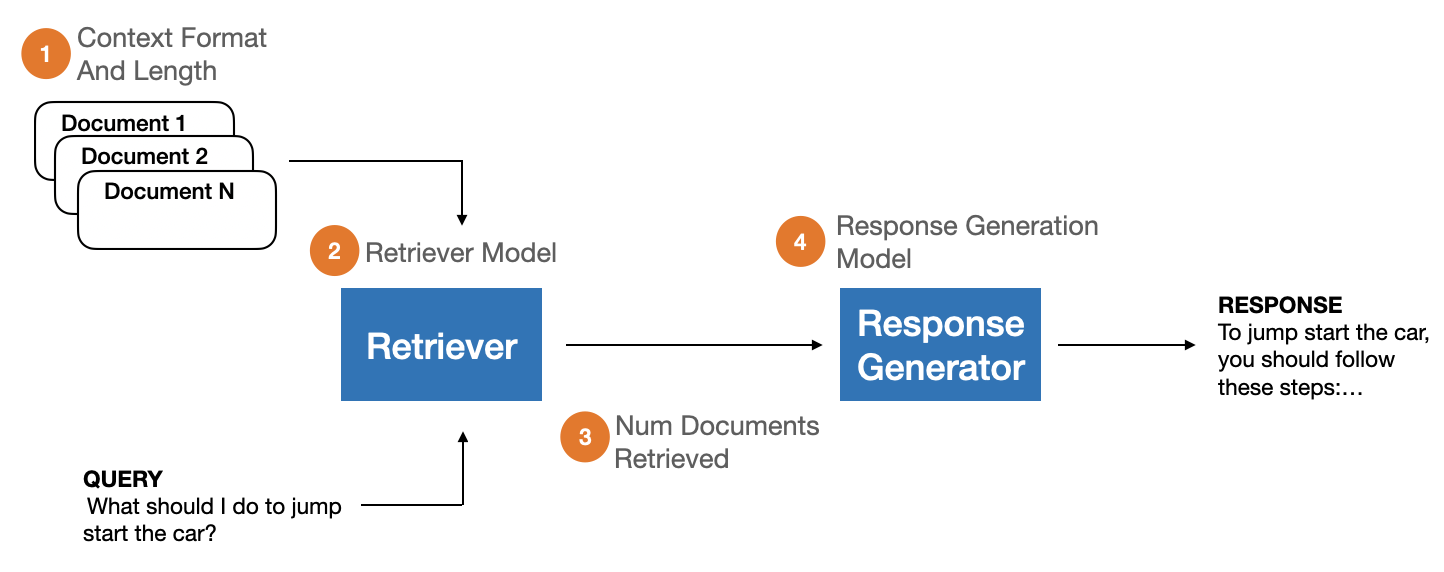
Retrieval-Augmented Generation (RAG) has become a standard architectural pattern for incorporating domain-specific knowledge into user-facing chat applications powered by Large Language Models (LLMs). RAG systems are characterized by (1) a document retriever that queries a domain-specific corpus for context information relevant to an input query, and (2) an LLM that generates a response based on the provided query and context. However, comprehensive evaluation of RAG systems remains a challenge due to the lack of unified evaluation criteria and annotated datasets. In response, we introduce RAGBench: the first comprehensive, large-scale RAG benchmark dataset of 100k examples. It covers five unique industry-specific domains and various RAG task types. RAGBench examples are sourced from industry corpora such as user manuals, making it particularly relevant for industry applications. Further, we formalize the TRACe evaluation framework: a set of explainable and actionable RAG evaluation metrics applicable across all RAG domains. We release the labeled dataset at https://huggingface.co/datasets/rungalileo/ragbench. RAGBench explainable labels facilitate holistic evaluation of RAG systems, enabling actionable feedback for continuous improvement of production applications. Thorough extensive benchmarking, we find that LLM-based RAG evaluation methods struggle to compete with a finetuned RoBERTa model on the RAG evaluation task. We identify areas where existing approaches fall short and propose the adoption of RAGBench with TRACe towards advancing the state of RAG evaluation systems.
연구 동기 및 목표
- 다양한 도메인에서 검색-강화 생성(RAG) 시스템에 대한 표준화된 평가를 촉진한다.
- 여러 산업을 포괄하는 대규모의 실세계 RAG 벤치마크(100k 샘플)를 제공한다.
- TRACe 프레임워크를 정의하여 리트리버와 제너레이터 구성요소가 RAG 품질에 기여하는 정도를 정량화한다.
- 세분화되고 설명 가능한 라벨을 통해 시스템 개선에 필요한 실행 가능한 피드백을 가능하게 한다.
제안 방법
- 생의학, 일반 지식, 법률, 고객 지원, 금융 도메인에 걸친 12개 소스의 구성요소 데이터를 수집하고 RAG 형식으로 통합한다.
- 생산 설정을 시뮬레이션하기 위해 컨텍스트 길이, 검색 문서 수, 도메인, 제너레이터 모델 등 RAG 매개변수를 다양화한다.
- 사슬사고(chain-of-thought) 기법을 활용한 GPT-4-turbo 프롬프트로 ground-truth 관련성, 활용도, 준수 토큰을 주석화하고, Spans로부터 Completeness를 도출한다.
- 토큰 스팬에 기반한 형식적 정의를 갖춘 TRACe 지표: Context Relevance, Context Utilization, Completeness, Adherence를 제안한다.
- RAGBench에서 기존 RAG 평가 방법(LLM 평가자, RAGAS, TruLens)과 미세조정된 DeBERTa 기반 평가자를 평가한다.
- LLM 평가자가 미세조정된 전문가 모델에 비해 TRACe 지표에서 종종 열세임을 보여주는 벤치마크 비교를 제공한다.
실험 결과
연구 질문
- RQ1대규모 다도메인 RAG 벤치마크가 리트리버와 제너레이터 구성요소의 일관된 평가를 가능하게 할 수 있는가?
- RQ2설명 가능한 TRACe 지표(Utilization, Relevance, Adherence, Completeness)가 생산 RAG 시스템 개선에 실행 가능한 지침을 제공하는가?
- RQ3제로샷/소수샷 LLM 평가자가 도메인 간 RAG 평가에서 미세조정된 판별 모델과 어떻게 비교되는가?
- RQ4RAGBench에서 맥락 관련성 예측과 활용도 예측의 상대적 난이도는 무엇인가?
- RQ5작은 모델(예: DeBERTa-large)의 미세조정이 대부분의 데이터셋에서 LLM 기반 평가자를 능가하는가?
주요 결과
- RAGBench는 5개 도메인에 걸친 12개의 구성 데이터세트를 포함하며, 장문 컨텍스트 CUAD와 수치가 풍부한 FinQA/TAT-QA를 포함한다.
- TRACe 지표는 생성된 답변에 대한 리트리버 관련성, 맥락 활용도, 준수, 완전성의 세부적인 평가를 가능하게 한다.
- 미세조정된 DeBERTa-large가 대부분의 데이터셋에서 TRACe 지표로써 제로샷 LLM 평가자보다 일반적으로 높은 성능을 보인다.
- 맥락 관련성 예측이 활용도보다 더 어렵고(RMSE가 더 높음) 이는 정답에 필요한 맥락을 식별하는 복잡성을 반영한다.
- LLM 평가자(GPT-3.5, RAGAS, TruLens)는 미세조정된 전문가 모델에 비해 경쟁적이지만 보편적으로 우수하지는 않다.
- GPT-4-turbo를 통한 RAGBench 주석은 시뮬레이션 데이터에서 ground truth와 높은 Kendall의 타우 상관을 달성하여 주석 타당성을 뒷받침한다.

더 나은 연구,지금 바로 시작하세요
연구 설계부터 논문 작성까지, 연구 시간을 획기적으로 줄여보세요.
카드 등록 없음 · 무료 플랜 제공
이 리뷰는 AI가 만들고, 인간 에디터가 검토했습니다.