
[논문 리뷰] TwinExplainer: Explaining Predictions of an Automotive Digital Twin
TwinExplainer는 딥러닝 기반 자동차 디지털 트윈의 예측을 해석할 수 있도록 하는 세 단계의 해석 가능한 AI 프레임워크를 제안한다. SHAP 기반의 특성 기여도를 활용하여, 정상 또는 비정상 시스템 행동에 가장 영향을 미치는 센서 채널을 규명함으로써, 차량 유지보수에서 신뢰도와 의사결정 능력을 향상시킨다. 힘의 그림과 같은 시각화 기법을 통해 전역적이고 국소적인 설명을 생성함으로써, 예측의 해석 가능성을 높인다.
Vehicles are complex Cyber Physical Systems (CPS) that operate in a variety of environments, and the likelihood of failure of one or more subsystems, such as the engine, transmission, brakes, and fuel, can result in unscheduled downtime and incur high maintenance or repair costs. In order to prevent these issues, it is crucial to continuously monitor the health of various subsystems and identify abnormal sensor channel behavior. Data-driven Digital Twin (DT) systems are capable of such a task. Current DT technologies utilize various Deep Learning (DL) techniques that are constrained by the lack of justification or explanation for their predictions. This inability of these opaque systems can influence decision-making and raises user trust concerns. This paper presents a solution to this issue, where the TwinExplainer system, with its three-layered architectural pipeline, explains the predictions of an automotive DT. Such a system can assist automotive stakeholders in understanding the global scale of the sensor channels and how they contribute towards generic DT predictions. TwinExplainer can also visualize explanations for both normal and abnormal local predictions computed by the DT.
연구 동기 및 목표
- 딥러닝 기반 자동차 디지털 트윈의 해석 불가능성 문제를 해결하여, 핵심 유지보수 응용 분야에서 사용자 신뢰도 향상과 보급을 촉진한다.
- 특히 복잡한 사이버-물리 시스템인 차량에서 사용되는 최첨단 딥러닝 모델의 '블랙박스' 성격을 극복한다.
- 정비사, 운영자, 엔지니어 등 자동차 이해관계자가 디지털 트윈이 특정 센서 채널을 정상 또는 이면으로 분류하는 이유를 이해할 수 있도록 한다.
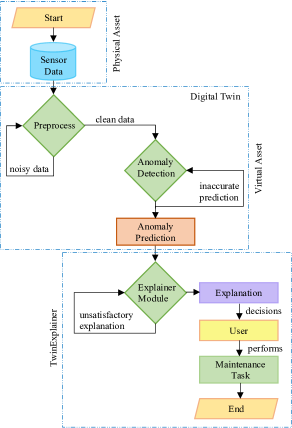
- 실시간 차량 진단을 위한 데이터 처리, 디지털 트윈 추론, 설명 생성을 통합하는 체계적인 파이프라인을 개발한다.
- 특성 기여도와 SHAP 값을 활용하여 예측의 전역적(전체 시스템 수준) 및 국소적(개별 인스턴스 기반) 설명을 제공한다.
제안 방법
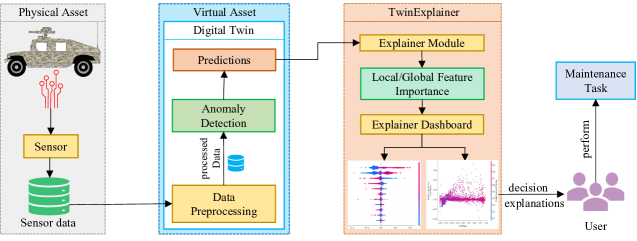
- 세 단계로 구성된 아키텍처 파이프라인을 활용한다: (1) VePro 데이터셋에서 시간적 시계열 센서 데이터의 수신 및 전처리, (2) 이상 탐지용 딥러닝 분류기로 시간적 컨volution 네트워크(TCN) 학습, (3) 샤플리드 덧셈 설명(Shapley Additive exPlanations, SHAP)을 활용한 설명 생성.
- SHAP를 적용하여 각 센서 채널(예: 엔진 온도, 연료 소비율)이 모델 예측 출력에 기여하는 정도를 정량화한다.
- 각 예측에 대해 양의 영향과 음의 영향을 보여주는 힘의 그림을 활용한 국소적 설명을 생성하며, 색상 코드가 부여된 화살표로 영향의 방향성과 크기를 시각화한다.
- 전체 데이터셋에 걸쳐 특성 기여도의 추세를 보여주는 요약 그림과 의존성 그림을 활용해 전역적 설명을 생성한다.
- 힘의 그림에서 기저 값(학습 세트에서의 평균 예측)을 기준점으로 삼아 개별 예측의 맥락을 제공한다.
- 정상 및 비정상 예측를 동시에 시각화하여 기여도의 차이를 비교하고 시스템 건강 상태의 핵심 지표를 식별한다.
실험 결과
연구 질문
- RQ1딥러닝 기반 자동차 디지털 트윈의 예측을 정비사나 운영자와 같은 비기술적 이해관계자가 이해할 수 있도록 하는 방법은 무엇인가?
- RQ2어느 센서 채널이 디지털 트윈의 시스템 상태를 정상 또는 비정상으로 분류하는 데 가장 크게 기여하는가?
- RQ3SHAP 기반 특성 기여도는 차량 디지털 트윈에서 국소적(개별 인스턴스 기반) 및 전역적(전체 시스템 수준) 예측을 효과적으로 설명할 수 있는가?
- RQ4실제 차량 데이터셋에서 정상 상태와 비정상 상태 간 특성 기여도는 어떻게 다를까?
- RQ5시각적 설명은 예측 유지보수에서 사용자 신뢰도와 의사결정 능력을 어느 정도 향상시키는가?
주요 결과
- 정상 예측의 힘의 그림(점수 0.63)은 TrOutShaftSp, EngCoolantTemp, FuelRate, AccelPedalPos, TransOilTemp, VehSpeedEng가 예측에 가장 긍정적인 영향을 미쳤음을 드러냈다.
- 동일한 정상 예측에서 InjCtlPres, PctEngLoad, TrSelGr, TransConvLockUpEngaged, BoostPres, IntManTemp 등의 특성은 결과에 부정적인 영향을 미쳤다.
- 비정상 예측(동일한 점수 0.63)에서도 TrOutShaftSp는 가장 긍정적인 영향을 미친 특성로 남아 있었으며, TransOilTemp와 EngCoolantTemp는 가장 부정적인 영향을 미친 특성로 나타났다.
- 정상 예측에서는 InjCtlPres가 가장 부정적인 영향을 미치는 특성로 규명되었고, 비정상 케이스에서는 TransOilTemp가 가장 해로운 영향을 미쳤다.
- 시각화 결과는 정상 상태와 비정상 상태 간 특성 기여도의 명확한 차이를 보여주었으며, 이해관계자가 핵심 고장 지표를 식별하는 데 기여했다.
- 프레임워크는 SHAP를 활용해 전역적 및 국소적 설명을 성공적으로 생성하였으며, 힘의 그림는 특성 효과의 방향성과 크기를 효과적으로 전달하였다.
더 나은 연구,지금 바로 시작하세요
논문 읽기부터 검토까지, 연구 시간을 획기적으로 줄여보세요.
카드 등록 없음 · 무료 플랜 제공
이 리뷰는 AI가 만들고, 인간 에디터가 검토했습니다.