
[논문 리뷰] Very high resolution canopy height maps from RGB imagery using self-supervised vision transformer and convolutional decoder trained on Aerial Lidar
이 논문은 Self-supervised 비전 트랜스포머 인코더와 Dense prediction 디코더를 사용해 RGB Maxar 영상으로부터 매우 해상도가 높은 캐노피 높이 맵을 생성하고, GEDI 기반 글로벌 재스케일링으로 다듬어 NEON, CA-Brande, 상파울루의 항공 LiDAR와 비교 평가한다.
Vegetation structure mapping is critical for understanding the global carbon cycle and monitoring nature-based approaches to climate adaptation and mitigation. Repeated measurements of these data allow for the observation of deforestation or degradation of existing forests, natural forest regeneration, and the implementation of sustainable agricultural practices like agroforestry. Assessments of tree canopy height and crown projected area at a high spatial resolution are also important for monitoring carbon fluxes and assessing tree-based land uses, since forest structures can be highly spatially heterogeneous, especially in agroforestry systems. Very high resolution satellite imagery (less than one meter (1m) Ground Sample Distance) makes it possible to extract information at the tree level while allowing monitoring at a very large scale. This paper presents the first high-resolution canopy height map concurrently produced for multiple sub-national jurisdictions. Specifically, we produce very high resolution canopy height maps for the states of California and Sao Paulo, a significant improvement in resolution over the ten meter (10m) resolution of previous Sentinel / GEDI based worldwide maps of canopy height. The maps are generated by the extraction of features from a self-supervised model trained on Maxar imagery from 2017 to 2020, and the training of a dense prediction decoder against aerial lidar maps. We also introduce a post-processing step using a convolutional network trained on GEDI observations. We evaluate the proposed maps with set-aside validation lidar data as well as by comparing with other remotely sensed maps and field-collected data, and find our model produces an average Mean Absolute Error (MAE) of 2.8 meters and Mean Error (ME) of 0.6 meters.
연구 동기 및 목표
- 탄소 순환 평가 및 FLR 모니터링을 지원하기 위한 매우 높은 해상도 식생 구조 매핑의 동기 부여 및 가능성 확보.
- Global Maxar RGB 이미지에 대해 보편적 식생 특징을 추출하기 위해 자체 감독 인코더를 개발하고 훈련.
- 항공 LiDAR(1 m CHM)에서 픽셀별 캐노피 높이를 예측하기 위한 Dense Prediction Decoder를 학습.
- 교차 사이트 일반화를 향상시키기 위한 GEDI 기반 글로벌 보정으로 예측을 다듬기.
- California와 São Paulo에 대한 고해상도 CHM을 제공하고 LiDAR 및 기존 CHM과 평가.
제안 방법
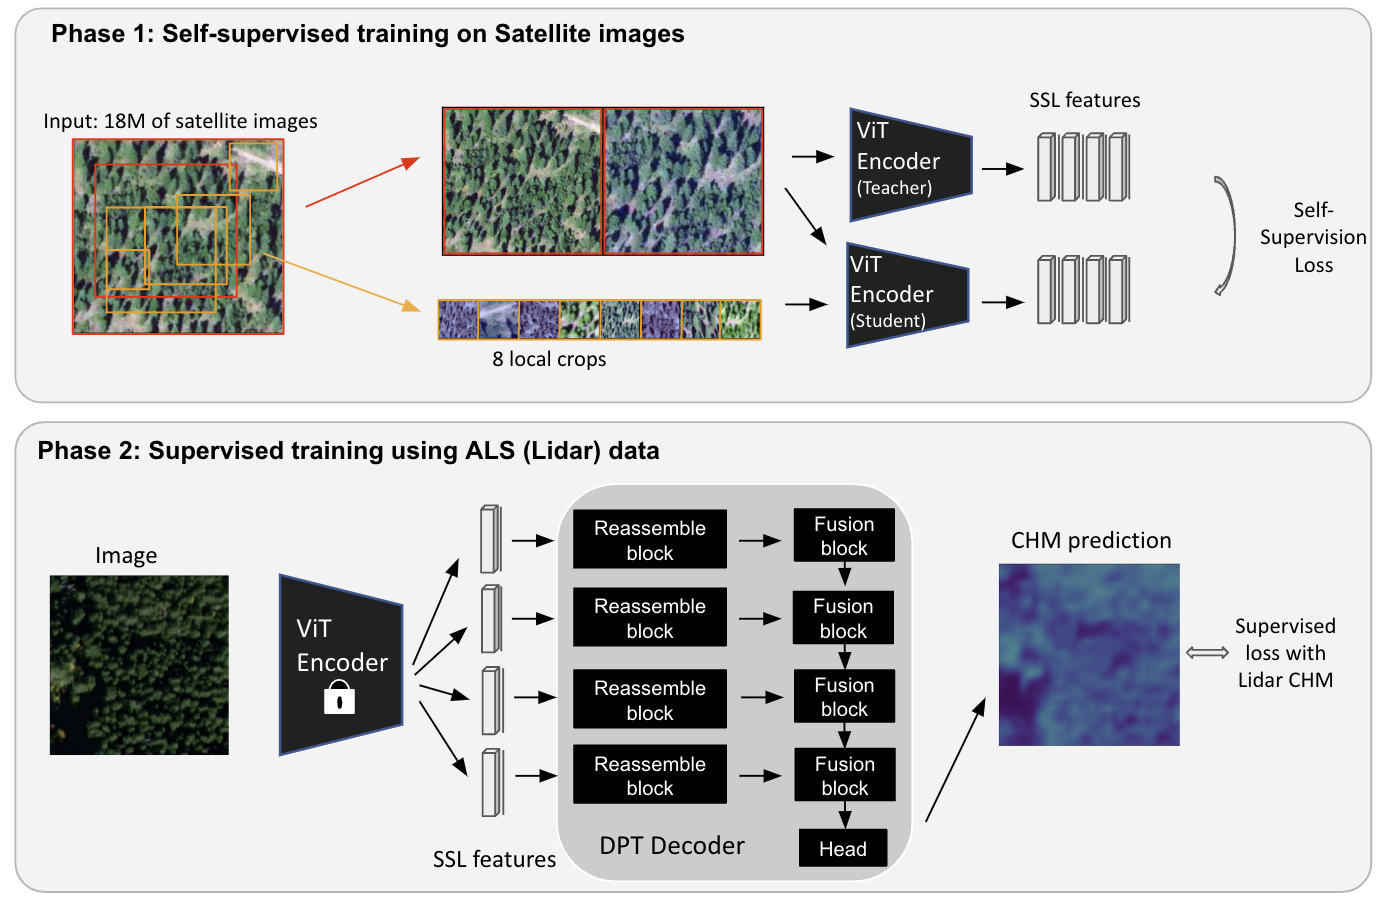
- 18백만 개의 256x256 Maxar RGB 썸네일에서 훈련된 대형 자체 지도 학습 Vision Transformer(ViT) 인코더를 사용합니다(SSL 단계).
- SSL 특징 위에 Dense Prediction Transformer(DPT) 디코더를 학습시켜 고해상도 CHM을 예측합니다(phase 2).
- CANOPY height 회귀를 위한 Sigloss 기반 목표와 학습 안정화를 위한 이진화/분류 출력도 적용합니다.
- GEDI RH95를 예측하기 위해 128x128 RGB 패치에서 GEDI 기반 합성곱 네트워크를 별도로 학습합니다(글로벌 보정).
- GEDI가 예측한 CHM과 ALS 기반 분위수에서 Dense 보정 인자 gamma(x)를 계산하여 추론 시 ALS 예측치를 재스케일링합니다(포스트 프로세싱).
- ResUNet 기본 모델 및 이전 CHM 맵과 비교하고 NEON, CA-Brande, São Paulo 데이터셋으로 검증합니다.
실험 결과
연구 질문
- RQ1고해상도 RGB 영상의 자체 감독 특징이 다양한 생물군에서 정확한 캐노피 높이 추정으로 일반화될 수 있는가?
- RQ2SSL 인코더와 Dense Transformer 디코더를 결합하면 기존 방법보다 더 높은 해상도의 CHM을 얻을 수 있는가?
- RQ3GEDI 기반 재스케일링 보정이 ALS 유도 CHM의 위치 간 정확도와 일반화를 개선하는가?
- RQ4제안 방법의 정량적 정확도(MAE, RMSE, R^2, ME)가 NEON, CA-Brande, São Paulo 테스트 세트에서 어떻게 되는가?
- RQ5제안된 고해상도 CHMs가 ~10 m–30 m 해상도의 기존 글로벌 맵과 비교해 어떤 차이가 있는가?
주요 결과
- SSL 기반 모델(18M Maxar 이미지로 학습)과 DPT 디코더가 NEON 및 CA-Brande 데이터셋에서 ResUNet 기반의 정확도보다 더 나은 캐노피 높이 정확도를 보인다.
- 상파울루에서 GEDI 보정 단계(SSL+GEDI)가 최상의 결과를 제공하며 글로벌 GEDI 감독으로 일반화가 향상됨을 시사한다.
- 표 2는 캐노피 높이 지표를 보여주며 SSL+GEDI가 평균적으로 MAE 2.8 m, RMSE 4.5 m, R^2 0.63, ME 1.5 m를 달성해 다수의 케이스에서 ResUNet 기반보다 우수하다.
- 이전의 글로벌 CHM(Lang et al. 2022a; Potapov et al. 2021)과 비교할 때 생성된 맵은 해상도가 더 높고(~0.59 m GSD 입력, 1 m CHM 출력) 검증 LiDAR에서 경쟁력 있는 정확도를 보인다.
- 저자는 전체 해상도 데이터셋을 AWS OpenData 및 Earth Engine을 통해 클라우드 최적화 geotiffs로 공개했다.
- 이 접근법은 California 및 São Paulo에 대한 완전한 해상도 CHM을 제공하여 보다 세밀한 탄소 매핑과 FLR 모니터링을 가능하게 한다.

더 나은 연구,지금 바로 시작하세요
논문 읽기부터 검토까지, 연구 시간을 획기적으로 줄여보세요.
카드 등록 없음 · 무료 플랜 제공
이 리뷰는 AI가 만들고, 인간 에디터가 검토했습니다.