
[논문 리뷰] Virgo Detector Characterization and Data Quality during the O3 run
이 논문은 제3기 관측 런(O3) 동안 고급 바이로(Advanced Virgo) 중력파 탐지기의 특성과 데이터 품질을 종합적으로 분석하며, BRUco와 MONET와 같은 고급 도구를 활용해 상관된 노이즈 원인을 식별하고 진단한다. 이는 일관성 기반 기법이 인스트루멘터 노이즈, 예를 들어 스텝 컨트롤과 연관된 16.25 Hz 조절 진동과 같은 노이즈를 효과적으로 분리함으로써 데이터 품질 향상과 중력파 이벤트 탐지 향상에 기여함을 보여준다.
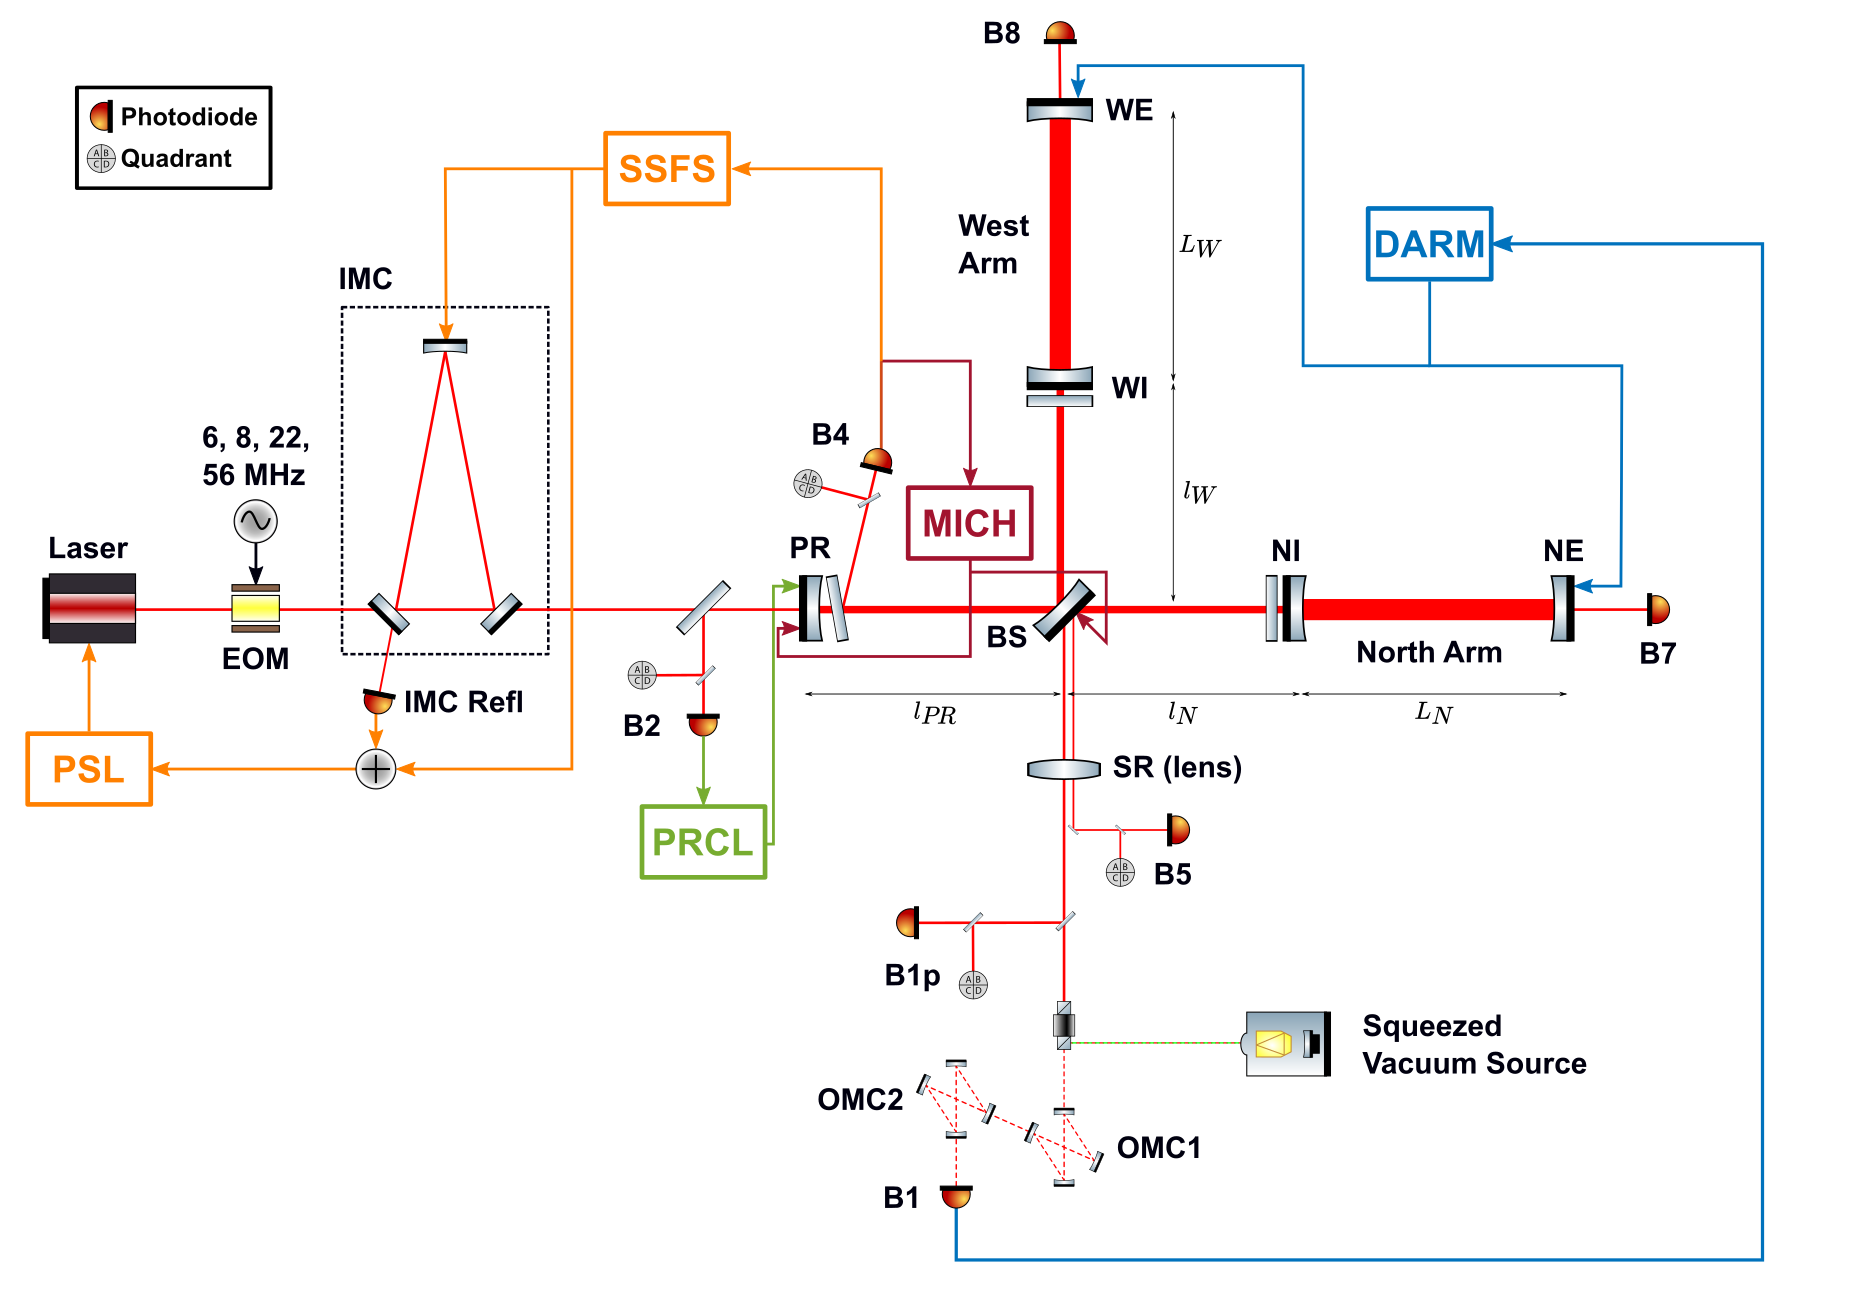
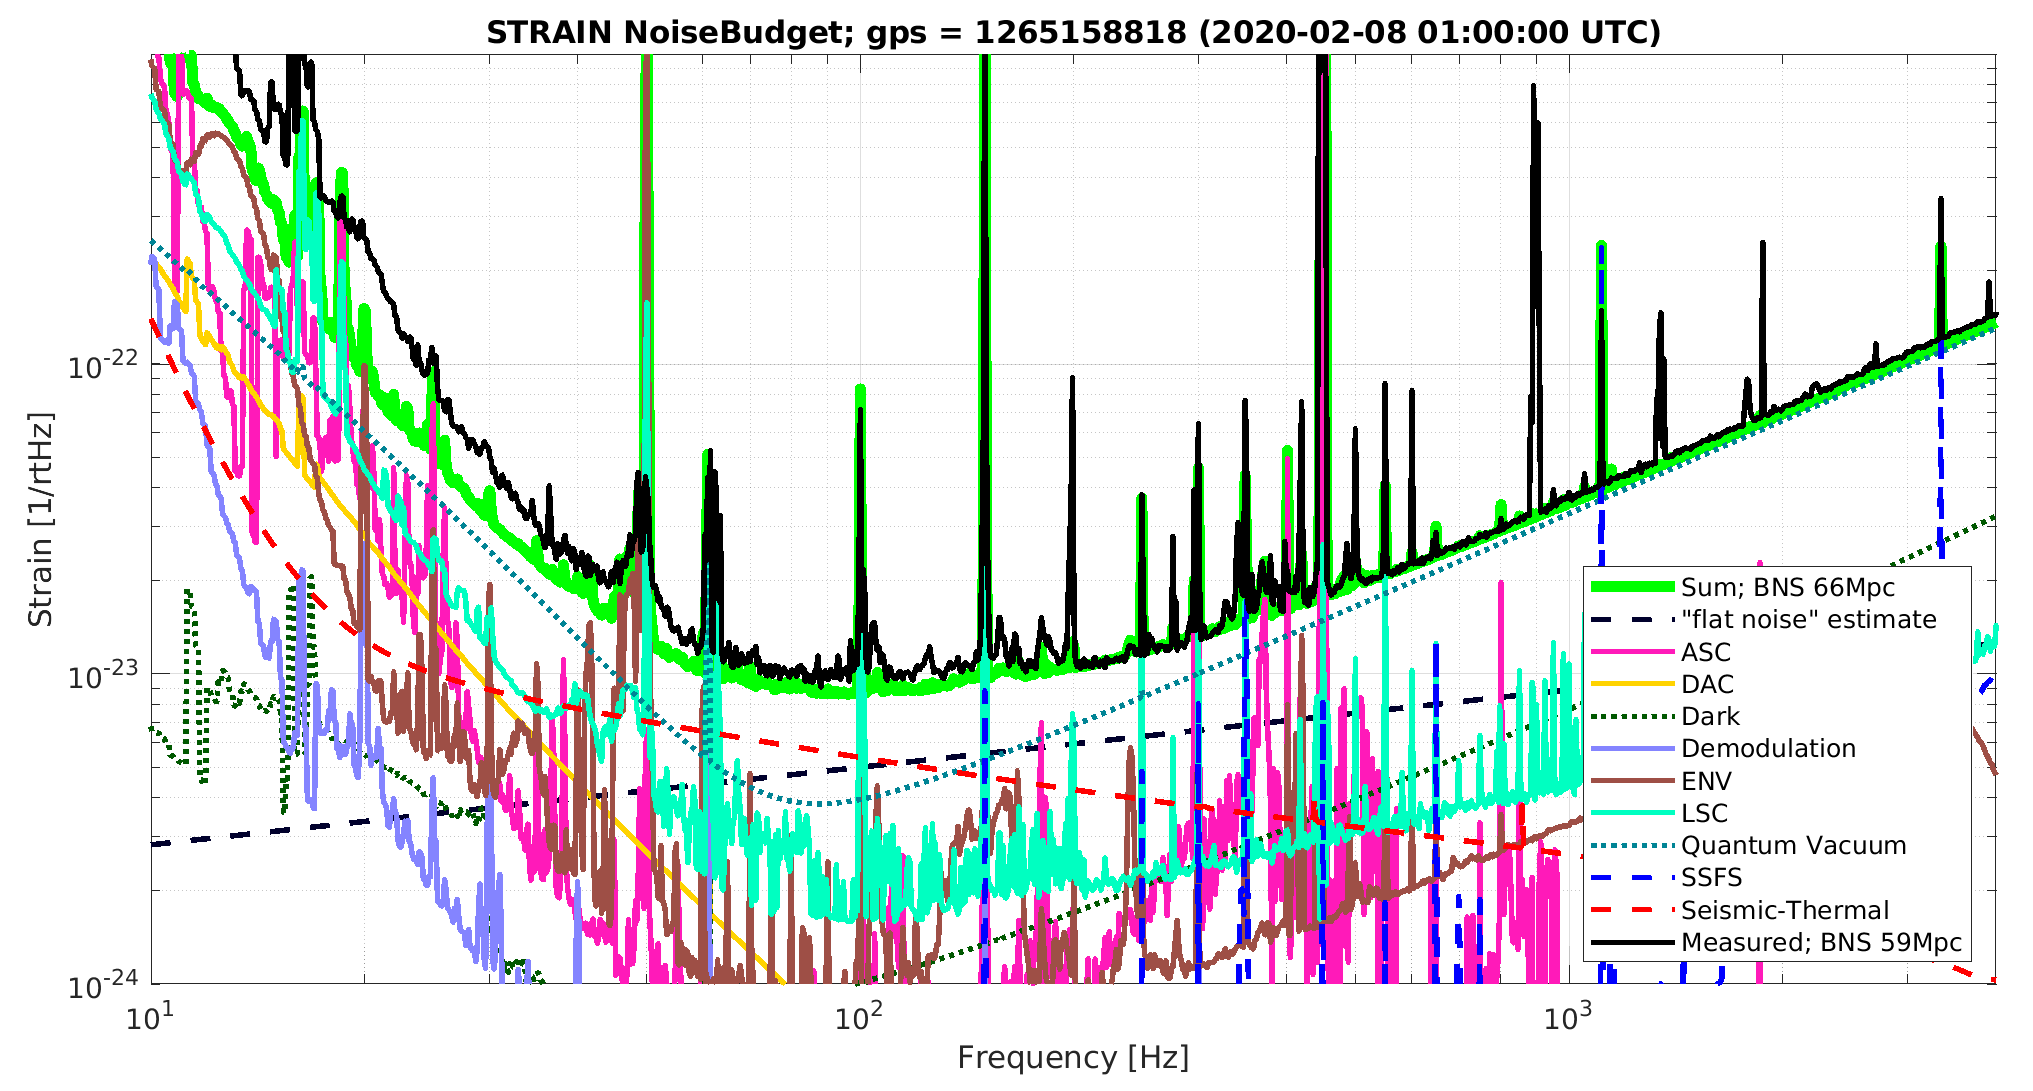
The Advanced Virgo detector has contributed with its data to the rapid growth of the number of detected gravitational-wave signals in the past few years, alongside the two LIGO instruments. First, during the last month of the Observation Run 2 (O2) in August 2017 (with, most notably, the compact binary mergers GW170814 and GW170817) and then during the full Observation Run 3 (O3): an 11 months data taking period, between April 2019 and March 2020, that led to the addition of about 80 events to the catalog of transient gravitational-wave sources maintained by LIGO, Virgo and KAGRA. These discoveries and the manifold exploitation of the detected waveforms require an accurate characterization of the quality of the data, such as continuous study and monitoring of the detector noise. These activities, collectively named {\em detector characterization} or {\em DetChar}, span the whole workflow of the Virgo data, from the instrument front-end to the final analysis. They are described in details in the following article, with a focus on the associated tools, the results achieved by the Virgo DetChar group during the O3 run and the main prospects for future data-taking periods with an improved detector.
연구 동기 및 목표
- 제3기 중력파 관측 런(O3) 기간 동안 고급 바이로 탐지기의 성능과 데이터 품질을 평가하기 위해.
- 일관성 기반 분석을 활용해 탐지기 감도에 영향을 주는 상관 노이즈 원인을 식별하고 특성화하기 위해.
- 실시간 및 후처리 노이즈 진단을 위해 BRUco와 MONET와 같은 도구를 검증하고 구현하기 위해.
- 천체 물리적 신호에서 인스트루멘터리 아티팩트를 분리함으로써 중력파 이벤트 탐지의 신뢰도를 향상시키기 위해.
- LIGO-Virgo-KAGRA 협업을 지원하기 위해 O3 데이터에 대한 세부적인 데이터 품질 보고서와 진단 도구를 제공하기 위해.
제안 방법
- DARM 채널과 보조 채널 간의 주파수 대역별 크로스스펙트럼 일관성의 제곱을 계산하기 위해 BRUco 도구를 사용하였다.
- 일관성 분석을 위해 1200초의 데이터 세그먼트 길이를 사용하고 출력 주파수를 1 kHz로 리샘플링하였다.
- 조절되는 보조 채널의 일관성 계산에서 5 Hz의 저통과 필터 커프로프를 적용하였다.
- DARM 채널과 조절된 보조 신호 간의 일관성을 계산하기 위해 MONET를 사용하였으며, 캐리어 신호와 저통과 필터링된 조절기 신호를 활용하였다.
- 각 분석에 대해 계층적 출력 디렉터리를 생성하였으며, 각 조절기 채널 별로 하위 디렉터리와 관련된 일관성 표 및 그림을 포함하였다.
- BRUco와 MONET의 결과를 통합하여 매일의 프로젝션과 시각화를 제작하여 지속적인 노이즈 라인을 식별하였다.
실험 결과
연구 질문
- RQ1O3 기간 동안 DARM 채널과 유의미한 일관성을 보이는 인스트루멘터리 노이즈 원인은 무엇인가?
- RQ2BRUco와 MONET는 고급 간섭계 탐지기에서 상관 노이즈를 식별하고 분리하는 데 얼마나 효과적인가?
- RQ3특정 주파수선, 예를 들어 16.25 Hz에서 가장 큰 기여를 하는 보조 채널은 무엇인가?
- RQ4일관성 기반 진단 기법은 중력파 탐지 감도를 떨어뜨리는 일시적 또는 지속적인 노이즈 라인을 탐지할 수 있는가?
- RQ5일관성 임계값(예: 0.3 또는 0.5)은 알려진 인스트루멘터리 액추에이터 또는 제어 시스템 행동과 어떻게 관련이 있는가?
주요 결과
- BRUco는 155–170 Hz 범위에서 고일관성 신호를 식별하여 그 인스트루멘터리 기원을 추가 조사하도록 유도하였다.
- MONET는 서쪽 입력 미러의 스텝 컨트롤 신호와 DARM 채널 간에 16.25 Hz에서 0.3 이상의 일관성을 검출하였다.
- 16.25 Hz의 일관성은 미러 스텝 컨트롤과 관련되어 있어 국소적 노이즈 원인임을 나타내었다.
- 16.25 Hz와 16.375 Hz에서 0.5 이상의 일관성 값이 관측되어 스텝 컨트롤과 DARM 간의 강한 결합을 시사하였다.
- MONET 분석 결과, 미러의 각도 정렬을 제어하는 데 사용되는 ASC_Diffp_TY 및 ASC_Diffp_TX 채널이 350 Hz에서 노이즈에 상당한 기여를 하였다.
- BRUco와 MONET의 병합 사용을 통해 노이즈 라인을 체계적으로 식별할 수 있었으며, 결과는 매일의 일관성 프로젝션과 스펙트럼 밀도 그림으로 시각화되었다.
더 나은 연구,지금 바로 시작하세요
논문 읽기부터 검토까지, 연구 시간을 획기적으로 줄여보세요.
카드 등록 없음 · 무료 플랜 제공
이 리뷰는 AI가 만들고, 인간 에디터가 검토했습니다.