
[논문 리뷰] Well Googled is Half Done: Multimodal Forecasting of New Fashion Product Sales with Image-based Google Trends
이 논문은 이미지 특징, 제품 메타데이터, 그리고 이미지 기반 Google Trends를 외생 신호로 융합하여 신제품 패션 상품의 판매를 예측하는 비자기적 Transformer 모델인 GTM-Transformer를 제안한다. 새로 공개된 VISUELLE 데이터셋에서 최신 기술 수준의 성능을 달성하며, 특히 제품 출시 7–10개월 전의 인기 트렌드 통합을 통해 WAPE를 1.5% 감소시켰다.
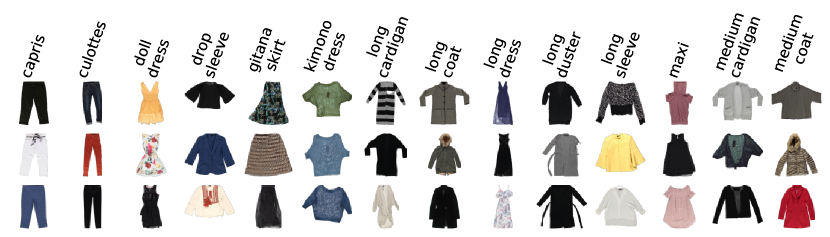
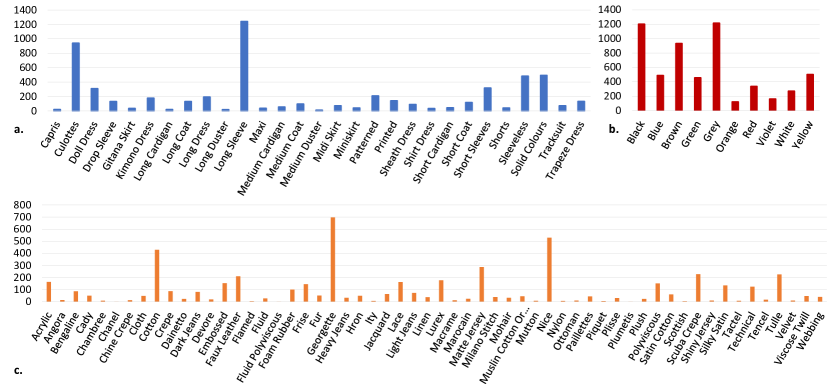
New fashion product sales forecasting is a challenging problem that involves many business dynamics and cannot be solved by classical forecasting approaches. In this paper, we investigate the effectiveness of systematically probing exogenous knowledge in the form of Google Trends time series and combining it with multi-modal information related to a brand-new fashion item, in order to effectively forecast its sales despite the lack of past data. In particular, we propose a neural network-based approach, where an encoder learns a representation of the exogenous time series, while the decoder forecasts the sales based on the Google Trends encoding and the available visual and metadata information. Our model works in a non-autoregressive manner, avoiding the compounding effect of large first-step errors. As a second contribution, we present VISUELLE, a publicly available dataset for the task of new fashion product sales forecasting, containing multimodal information for 5577 real, new products sold between 2016-2019 from Nunalie, an Italian fast-fashion company. The dataset is equipped with images of products, metadata, related sales, and associated Google Trends. We use VISUELLE to compare our approach against state-of-the-art alternatives and several baselines, showing that our neural network-based approach is the most accurate in terms of both percentage and absolute error. It is worth noting that the addition of exogenous knowledge boosts the forecasting accuracy by 1.5% in terms of Weighted Absolute Percentage Error (WAPE), revealing the importance of exploiting informative external information. The code and dataset are both available at https://github.com/HumaticsLAB/GTM-Transformer.
연구 동기 및 목표
- 기존 역사 데이터가 없는 신제품 패션 상품의 판매를 예측하는 문제에 대응하기 위해.
- 다중모달 판매 예측에 Google Trends 시계열을 외생 신호로 통합하는 것이 효과적인지 조사하기 위해.
- 오류 누적 문제를 피하기 위해 자동 회귀가 아닌 딥 러닝 모델을 개발하기 위해.
- 신제품 패션 상품 판매 예측을 위한 공개 벤치마크 데이터셋인 VISUELLE를 제작하고 공개하기 위해.
- 모델의 성능을 최신 기술 수준의 기준 모델들과 실제 비즈니스 정책(예: 60% 규칙)과 비교하기 위해.
제안 방법
- GTM-Transformer 모델은 Google Trends, 이미지 특징, 메타데이터에 대해 별도의 인코더를 갖춘 Transformer 기반 아키텍처를 사용한다.
- 특히 제품 출시 7–10개월 전의 시계열 세그먼트에 동적으로 주의를 기울일 수 있도록 크로스 어텐션 메커니즘을 적용한다.
- 모델은 비자기적 구조를 취해 첫 단계의 오류 누적 문제를 피하기 위해 모든 미래 단계를 동시에 예측한다.
- 이미지 특징은 사전 훈련된 모델을 통해 추출되며, 패션 IQ 속성은 이미지에서 자동으로 추론되어 다중모달 입력을 풍부하게 한다.
- 디코더는 다중 헤드 어텐션 메커니즘을 사용하여 인코딩된 Google Trends와 다중모달 특징에 주의를 기울이며 판매 예측을 생성한다.
- 모델는 예측 정확도를 최적화하기 위해 마스크된 다중 헤드 손실을 사용하여 엔드 투 엔드로 훈련된다.
실험 결과
연구 질문
- RQ1제품 속성에서 유도된 Google Trends 시계열은 신제품 패션 상품의 판매 예측 정확도를 크게 향상시킬 수 있는가?
- RQ2Google Trends 신호의 시계열적 위치(예: 수개월의 지연)가 예측 성능에 어떤 영향을 미치는가?
- RQ3비자기적 Transformer 아키텍처가 자기적 또는 전통적인 머신러닝 기준 모델에 비해 신제품 판매 예측에서 얼마나 뛰어난 성능을 보이는가?
- RQ4이미지 기반 특징과 자동으로 추론된 속성의 통합은 예측 성능 향상에 얼마나 효과적인가?
- RQ5제안된 모델은 첫 번째 주문 계획 단계에서 실제 비즈니스 정책(예: 60% 규칙)을 초월할 수 있는가?
주요 결과
- GTM-Transformer 모델은 비교된 모든 방법 중에서 가장 낮은 가중 평균 퍼센티지 오차(WAPE)를 기록했으며, 기준 모델 대비 오차를 1.5% 감소시켰다.
- 가장 정보가 많은 Google Trends 신호는 항상 제품 출시 7–10개월 전에 위치해 있으며, 크로스 어텐션 메커니즘의 피크 주의 가중치로 확인되었다.
- 외생 신호로 Google Trends 데이터를 추가함으로써 예측 정확도가 크게 향상되었으며, 신제품 상황에서 인기 우선 정보의 가치를 입증했다.
- 모델은 첫 주 판매 예측에서 60% 비즈니스 정책을 초월하여 평균 절대 오차를 313.6에서 262.3개로 감소시켰다.
- 첫 번째 주문 계획에서의 금전적 오차는 GTM-Transformer를 사용할 경우 324만 달러로, 60% 정책을 사용할 경우 392만 달러로 줄어들어 실제 비즈니스 영향을 보여주었다.
- 이미지, 메타데이터, 판매 데이터, Google Trends를 포함한 총 5,577개의 신제품 패션 상품을 담은 VISUELLE 데이터셋은 재현 가능한 벤치마크와 다중모달 판매 예측 분야의 향후 연구를 가능하게 한다.
더 나은 연구,지금 바로 시작하세요
논문 읽기부터 검토까지, 연구 시간을 획기적으로 줄여보세요.
카드 등록 없음 · 무료 플랜 제공
이 리뷰는 AI가 만들고, 인간 에디터가 검토했습니다.