
[논문 리뷰] XENONnT WIMP Search: Signal & Background Modeling and Statistical Inference
이 논문은 XENONnT 실험의 첫 번째 WIMP 탐색을 보이지 않는 통계적 분석을 통해 수행하였으며, cS1, cS2, 및 R 공간에서 종합적인 신호 및 배경 모델을 포함한다. 분석 결과, 스핀에 무관한 WIMP-핵자 단면적에 대한 새로운 상한선을 도출하였으며, $28\ \text{GeV}/c^2$에서 최소 $2.58 \times 10^{-47}\ \text{cm}^2$에 도달하였다. 유의미한 초과 신호는 관측되지 않았다.
The XENONnT experiment searches for weakly-interacting massive particle (WIMP) dark matter scattering off a xenon nucleus. In particular, XENONnT uses a dual-phase time projection chamber with a 5.9-tonne liquid xenon target, detecting both scintillation and ionization signals to reconstruct the energy, position, and type of recoil. A blind search for nuclear recoil WIMPs with an exposure of 1.1 tonne-years (4.18 t fiducial mass) yielded no signal excess over background expectations, from which competitive exclusion limits were derived on WIMP-nucleon elastic scatter cross sections, for WIMP masses ranging from 6 GeV/$c^2$ up to the TeV/$c^2$ scale. This work details the modeling and statistical methods employed in this search. By means of calibration data, we model the detector response, which is then used to derive background and signal models. The construction and validation of these models is discussed, alongside additional purely data-driven backgrounds. We also describe the statistical inference framework, including the definition of the likelihood function and the construction of confidence intervals.
연구 동기 및 목표
- 액체 크세논 시간 투과판을 사용하여 약하게 상호작용하는 거대한 입자(WIMPs)를 탐색하기.
- 전자 및 핵반발에 대한 정밀한 검출기 응답 모델을 개발하며, S2 다중성 및 파형 수준의 재구성 포함.
- 특히 방사성 뉴트론, 우연적 동시 발생, 표면 배경을 시뮬레이션 및 데이터 기반 방법을 사용하여 모델링하기.
- 편향을 방지하기 위해 보이지 않는 분석을 수행하여 배제 한계를 설정하는 통계적 엄밀성 확보하기.
- WIMP 질량이 6에서 500 GeV/$c^2$에 이르는 범위에서 스핀에 무관한 WIMP-핵자 산란 단면적에 대한 새로운 상한선 유도하기.
제안 방법
- 보정 데이터에 맞춘 전체 검출기 응답 모델을 사용하여 키토산 방출, 전하 수확, 파형 재구성 기능을 모두 포함하여 전자 반발(ER) 및 핵반발(NR)에 대해 모델링하였다.
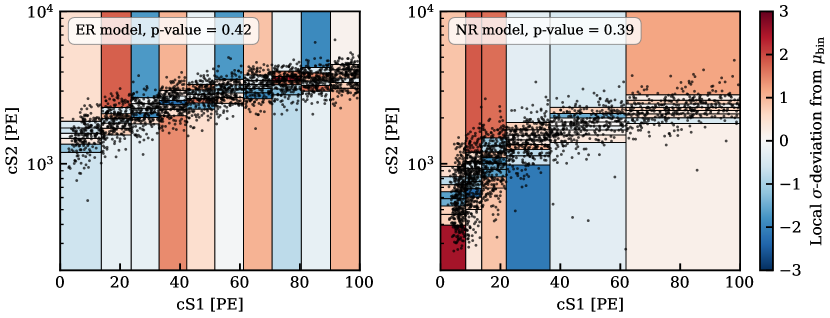
- S2 다중성 모델은 다중 에너지 분포가 발생하는 사건을 정확히 기술할 수 있도록 보정 데이터를 사용하여 검증하였다.
- 보조 측정을 통해 배경 비율을 제약 조건화하였으며, 뉴트론 배경는 다중 산란 대 단일 산란 비율 및 NR 보정 데이터의 비트 제거 효율성으로 측정하였다.
- 비트 제거되지 않은 단일 산란 뉴트론 배경은 시뮬레이션 및 측정된 뉴트론 상호작용 특성을 조합하여 예측하였다.
- cS1–cS2 분석 영역 내 ER 모델의 불확실성을 고려하기 위해 두 개의 형태 매개변수를 도입하였다.
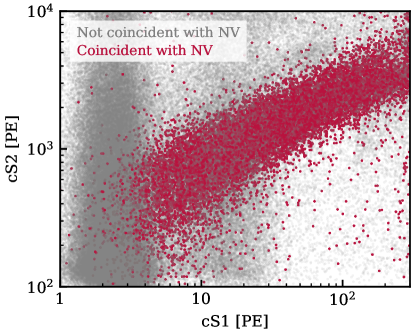
- 우연적 동시 발생 및 표면 배경은 데이터 기반 기법을 사용하여 모델링하였으며, 신호 영역 외부의 보정 및 과학 데이터에서 검증하였다.
실험 결과
연구 질문
- RQ1넓은 질량 범위에서 XENONnT 실험의 스핀에 무관한 WIMP-핵자 산란에 대한 감도는 어떠한가?
- RQ2검출기 응답 모델은 복잡한 S2 다중성 패턴을 포함한 ER 및 NR 사건을 얼마나 정확하게 기술할 수 있는가?
- RQ3방사성 뉴트론은 배경에 얼마나 기여하는가? 그리고 보정 데이터를 사용하여 얼마나 잘 제약 조건화할 수 있는가?
- RQ4데이터 기반 배경 모델은 시뮬레이션 대비 신호 영역의 배경 수준을 예측할 때 어떻게 비교되는가?
- RQ5엄격한 통계적 추론을 수행한 보이지 않는 분석 후에 도출된 WIMP-핵자 단면적에 대한 상한선는 무엇인가?
주요 결과
- 모든 테스트된 WIMP 질량에서 지역적 발견 p-값이 0.2 이상이었으며, 보이지 않는 WIMP 탐색 데이터에서 유의미한 신호 초과는 관측되지 않았다.
- WIMP 질량이 $28\ \text{GeV}/c^2$일 때 스핀에 무관한 WIMP-핵자 단면적에 대한 최소 상한선은 $2.58 \times 10^{-47}\ \text{cm}^2$에 도달하였다.
- 방사성 뉴트론에 대한 배경 모델은 NR 보정 데이터에서 다중 산란 대 단일 산란 비율 및 뉴트론 비트 제거 효율성으로 성공적으로 제약 조건화되었다.
- 보정 후에 정의된 높은 오분석 거부 능력을 갖춘 적합도 검정을 통해 통계 모델이 검증되었다.
- 파워 제약 상한선(PCL) 임계값은 0.15에서 0.5로 상향 조정되어, 상한선이 항상 중앙값 이하의 비제약 상한선 이상에서만 설정되도록 보장하였다.
- 최종 최적 적합 모델 및 보정 적합 결과는 수용 가능하게 평가되어, 신호 및 배경 모델링의 강건성을 확인하였다.
더 나은 연구,지금 바로 시작하세요
논문 읽기부터 검토까지, 연구 시간을 획기적으로 줄여보세요.
카드 등록 없음 · 무료 플랜 제공
이 리뷰는 AI가 만들고, 인간 에디터가 검토했습니다.