[논문 리뷰] Zooming Out on Zooming In: Advancing Super-Resolution for Remote Sensing
논문은 원격-센싱 초해상도를 위한 지각 지표로 CLIPScore를 도입하고, 대규모 S2-NAIP 데이터셋을 구축하며, GAN, 확산, CNN 기반 방법을 비교하고, CLIPScore로 GANs(ESRGAN)가 다른 방법보다 우수함을 보여주며, 초해상 출력은 기계용 사용에는 덜 효과적임을 보이고; 또한 글로벌 모델을 학습시키고 데이터와 코드를 공개한다.
Super-Resolution for remote sensing has the potential for huge impact on planet monitoring by producing accurate and realistic high resolution imagery on a frequent basis and a global scale. Despite a lot of attention, several inconsistencies and challenges have prevented it from being deployed in practice. These include the lack of effective metrics, fragmented and relatively small-scale datasets for training, insufficient comparisons across a suite of methods, and unclear evidence for the use of super-resolution outputs for machine consumption. This work presents a new metric for super-resolution, CLIPScore, that corresponds far better with human judgments than previous metrics on an extensive study. We use CLIPScore to evaluate four standard methods on a new large-scale dataset, S2-NAIP, and three existing benchmark datasets, and find that generative adversarial networks easily outperform more traditional L2 loss-based models and are more semantically accurate than modern diffusion models. We also find that using CLIPScore as an auxiliary loss can speed up the training of GANs by 18x and lead to improved outputs, resulting in an effective model in diverse geographies across the world which we will release publicly. The dataset, pre-trained model weights, and code are available at https://github.com/allenai/satlas-super-resolution/.
연구 동기 및 목표
- 원격 센싱 초해상도 출력에 대해 인간의 판단과 일치하는 지표를 확립한다.
- 확장 가능한 학습 및 평가를 가능하게 하는 대규모의 공개 도메인 데이터셋(S2-NAIP)을 생성한다.
- 여러 원격 센싱 데이터셋에서 SR 방법(CNN, GAN, diffusion)을 체계적으로 비교한다.
- 후속 머신 작업에 대한 초해상 출력의 유용성과 인간 중심의 시각화 대비를 평가한다.
- 위의 연구결과를 활용하여 전 세계적으로 적용 가능한 초해상 모델을 개발하고 배포한다.
제안 방법
- CLIPScore를 제안한다, 이는 SR 품질에 대해 인간 판단과 상관하는 CLIP 기반 이미지 유사도 지표이다.
- Sentinel-2 및 NAIP 영상으로부터 120만 개의 LR-HR 쌍을 가진 S2-NAIP 데이터셋을 구성하고 공개한다.
- 네 가지 데이터셋에 걸쳐 SR 방법(SRCNN, HighResNet, ESRGAN, SR3)을 벤치마크하고 CLIPScore 및 LPIPS/cPSNR를 통해 지각 품질을 평가한다.
- SR 출력물이나 특성이 후속 작업을 개선하는지 조사하고 SR 표현을 활용한 전이 학습을 분석한다.
- CLIPScore 기반 보조 손실을 활용해 ESRGAN을 향상시켜 학습 속도를 높이고 출력 품질을 개선한다.
실험 결과
연구 질문
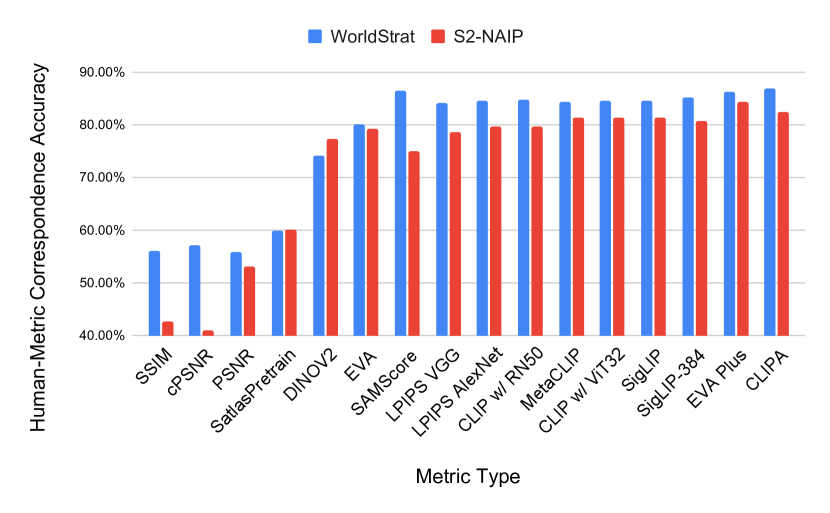
- RQ1CLIPScore가 원격-센싱 SR 출력에 대한 인간 판단과 얼마나 잘 상관하는가?
- RQ2데이터셋 규모(S2-NAIP)가 방법 간 SR 성능에 어떤 영향을 미치는가?
- RQ3원격-센싱 데이터에서 가장 우수한 지각 품질을 내는 SR 방법 계통(CNN, GAN, diffusion)은 무엇인가?
- RQ4SR 출력이 다운스트림 머신 작업에 유익한가, 아니면 주로 인간 시각화를 위한 것인가?
- RQ5CLIP 기반 보조 손실 및 도메인 지식으로 SR 학습을 개선해 더 나은 결과를 얻을 수 있는가?
주요 결과
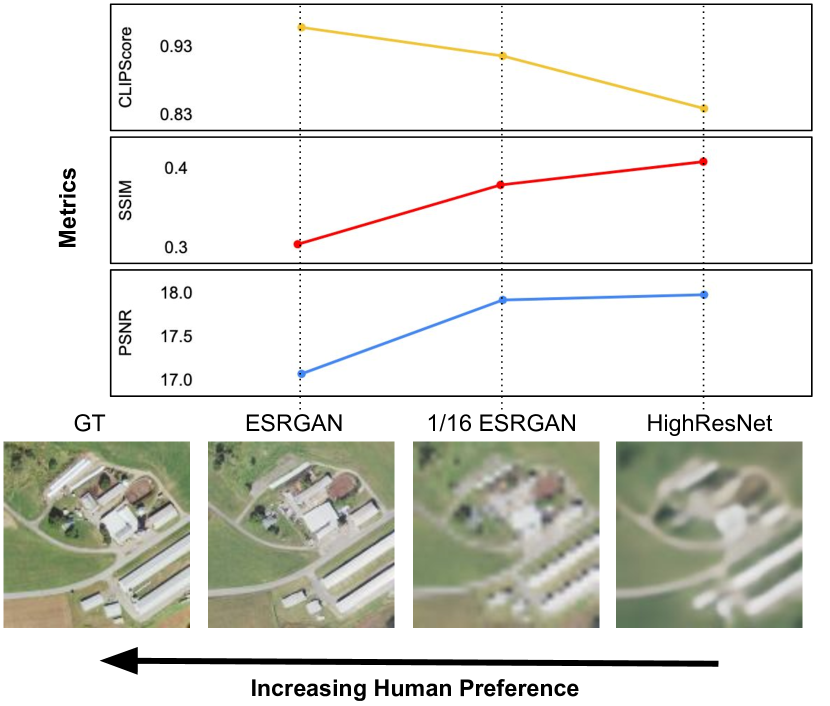
- 원격 탐지에서 SR에 대한 PSNR과 SSIM은 인간 판단과의 상관관계가 낮다.
- CLIPScore(특히 CLIPA-v2)는 SR 품질에 대해 인간 선호도와 최대 84.6%의 일치를 달성한다.
- GANs(ESRGAN)는 네 가지 데이터셋에서 CLIPScore 상 확산 및 L2 기반 모델보다 우수하다.
- CLIPScore 손실로 ESRGAN을 학습하면 학습이 18배 빠르게 진행되며 CLIPScore가 약 9 포인트 향상된다.
- SR 출력은 다운스트림 머신 작업에 대해 원래 LR 영상 사용보다 우수하지 않지만, SR 표현은 전이 학습을 개선할 수 있다.
- 대규모 S2-NAIP 데이터셋과 글로벌 ESRGAN 모델은 SR 출력의 규모 확장과 공개 배포를 가능하게 한다.
더 나은 연구,지금 바로 시작하세요
연구 설계부터 논문 작성까지, 연구 시간을 획기적으로 줄여보세요.
카드 등록 없음 · 무료 플랜 제공
이 리뷰는 AI가 만들고, 인간 에디터가 검토했습니다.