[논문 리뷰] Environmental Burden of United States Data Centers in the Artificial Intelligence Era
미국 데이터 센터는 지난 해에 105 million metric tons의 CO2e를 배출했고, 탄소 집약도는 전국 평균보다 대략 48% 높으며, 화석 연료가 전력 공급의 절반 이상을 차지했다.
The rapid proliferation of data centers in the US - driven partly by the adoption of artificial intelligence - has set off alarm bells about the industry's environmental impact. We compiled detailed information on 2,132 US data centers operating between September 2023 and August 2024 and determined their electricity consumption, electricity sources, and attributable CO$_{2}$e emissions. Our findings reveal that data centers accounted for more than 4% of total US electricity consumption - with 56% derived from fossil fuels - generating more than 105 million tons of CO$_{2}$e (2.18% of US emissions in 2023). Data centers' carbon intensity - the amount of CO$_{2}$e emitted per unit of electricity consumed - exceeded the US average by 48%. Our data pipeline and visualization tools can be used to assess current and future environmental impacts of data centers.
연구 동기 및 목표
- US 데이터 센터가 2023년 9월부터 2024년 8월까지 운영되면서 미국 총 소비에서의 전력 소비와 그 비중을 정량화한다.
- 데이터 센터에 전력을 공급하는 발전소와 균형 당국을 식별하고 이러한 원천에 배출을 귀속시킨다.
- 데이터 센터가 사용하는 전력의 연료 구성과 탄소 집약도를 특징지어 다른 부문 및 국가와 비교한다.
- 정책 및 완화를 위한 데이터 센터 에너지 사용 및 배출을 모니터링하는 재현 가능한 데이터 파이프라인과 공개 웹 플랫폼을 개발한다.
- 규제 조치와 개입을 통해 탄소 발자국을 줄이기 위한 지역/주 수준의 세분화를 제공한다.
제안 방법
- Baxtel 데이터, 웹 스크래핑, OpenStreetMap 검증을 이용해 2023년 9월부터 2024년 8월 사이에 운영되는 2,132개 미국 데이터 센터의 데이터세트를 구성했다.
- GBRT(gradient-boosted regression tree) 모델로 누락된 데이터 센터 전력 용량을 보완했으며 R2 = 0.77을 달성했다.
- 각 데이터 센터를 균형 당국에 할당하고 배출량 계산을 위해 EPA eGRID 데이터를 사용해 공급 전력 원천과 연결했다.
- 생성 가중 평균 배정 방법을 사용해 각 데이터 센터의 전력 수요를 특정 발전소에 귀속하고 CO2e 배출량을 계산했다.
- 탄소 집약도를 CO2e/kWh로 계산하고 미국 평균 및 국제 벤치마크와 비교했다.
- 균형 당국, 주, 카운티 수준에서 데이터 센터 에너지 부하, 배출, 연료 구성을 시각화하는 공개 웹 플랫폼을 개발했다.

실험 결과
연구 질문
- RQ1연구 기간 동안 미국 데이터 센터의 총 전력 소비량은 얼마이며 이는 미국 전력 사용에서 차지하는 비율은 얼마인가?
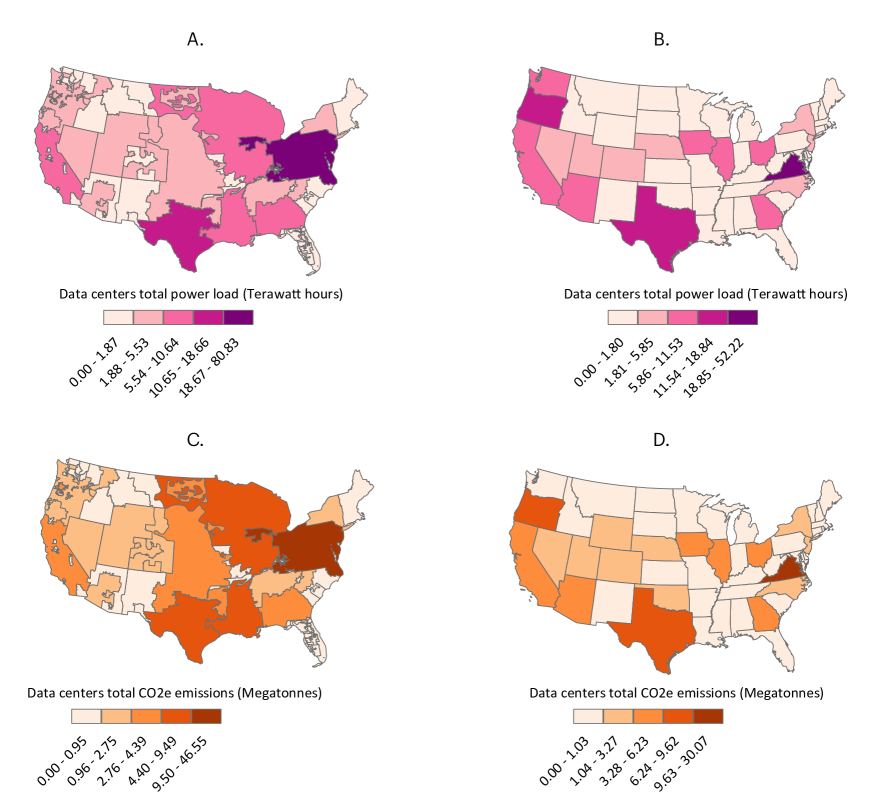
- RQ2데이터 센터에 귀속되는 CO2e 배출량은 얼마이며 이러한 배출량은 균형 당국 및 주별로 어떻게 달라지는가?
- RQ3데이터 센터가 사용하는 전력의 탄소 집약도는 얼마이며 미국 평균 및 국제 값과 어떻게 비교되는가?
- RQ4데이터 센터를 구동하는 연료 구성은 무엇이며 어떤 지역이 데이터 센터 에너지에 대해 화석 연료(특히 석탄)에 가장 많이 의존하는가?
- RQ5재현 가능한 데이터 파이프라인과 공개 플랫폼이 정책 조치를 위한 현재 및 미래의 데이터 센터 환경 영향 추적에 정확한가?
주요 결과
- 연구 기간 동안 데이터 센터는 약 192.64 TWh를 소비했으며, 이는 2022년 미국 총 에너지 소비의 약 4.59%를 차지한다.
- 데이터 센터에 귀속되는 총 CO2e 배출량은 105.59 million metric tons으로, 2022년 에너지 소비로 인한 미국 배출의 약 2.18% 및 미국 총 CO2e 배출의 1.66%에 해당한다.
- 화석 연료 발전소가 데이터 센터 전력의 56% 이상을 공급했으며, 석탄은 총 에너지의 16%, 원자력은 약 21%, 재생 가능 에너지는 약 22%를 차지했다.
- 데이터 센터의 가중 평균 탄소 집약도는 548 g CO2e/kWh로, 미국 평균인 369 g CO2e/kWh보다 약 48% 높다.
- 버지니아주, 텍사스주, 오리건주가 미국 내 데이터 센터 배출의 선도적 기여를 했으며 지역 배출 프로필에서 중요한 비중을 차지했다.
- 저자들은 균형 당국, 주, 카운티별로 데이터 센터의 에너지 사용 및 배출을 추적하는 공개 웹 플랫폼을 제공한다.
더 나은 연구,지금 바로 시작하세요
연구 설계부터 논문 작성까지, 연구 시간을 획기적으로 줄여보세요.
카드 등록 없음 · 무료 플랜 제공
이 리뷰는 AI가 만들고, 인간 에디터가 검토했습니다.