
[논문 리뷰] Ranking the Economic Importance of Countries and Industries
이 논문은 입력-출력 표를 통해 상호의존성을 모델링하고 카스케이딩 실패를 시뮬레이션하여 국가 및 산업의 경제적 중요도를 순위 매기는 네트워크 기반 프레임워크를 제안한다. 분석 결과, 2003년 이후 중국의 체계적 경제 영향력이 미국을 초월하여 점차 실패에 대한 내성을 증가시켜 왔으며, 반면 미국의 체계적 회복력은 시간이 지남에 따라 감소해 온 것으로 나타났다.
In the current era of worldwide stock market interdependencies, the global financial village has become increasingly vulnerable to systemic collapse. The recent global financial crisis has highlighted the necessity of understanding and quantifying interdependencies among the world's economies, developing new effective approaches to risk evaluation, and providing mitigating solutions. We present a methodological framework for quantifying interdependencies in the global market and for evaluating risk levels in the world-wide financial network. The resulting information will enable policy and decision makers to better measure, understand, and maintain financial stability. We use the methodology to rank the economic importance of each industry and country according to the global damage that would result from their failure. Our quantitative results shed new light on China's increasing economic dominance over other economies, including that of the USA, to the global economy.
연구 동기 및 목표
- 국가 및 산업 간 상호의존성을 모델링하여 글로벌 경제의 체계적 리스크를 정량화하는 방법을 개발하기 위해.
- 실패 시 초래하는 글로벌 손실을 기반으로 국가 및 산업의 경제적 중요도를 순위 매기기 위해.
- 네트워크 과학과 입력-출력 분석을 통해 체계적 취약점을 파악하고 금융 안정성을 향상시키기 위해.
- 특히 중국의 미국 대비 상대적 지배력이 어떻게 변화해 왔는지 평가하기 위해.
제안 방법
- 1995–2011년도 입력-출력 표를 기반으로 한 가중치가 부여된 출력 네트워크를 구축하며, 525개 산업을 노드로, 제품 가치를 간의 가중치로 사용한다.
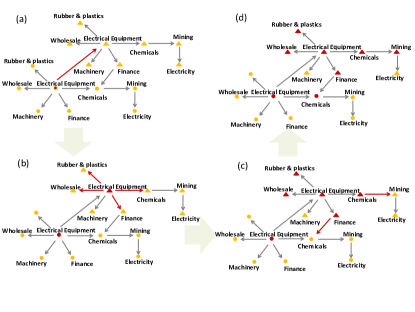
- 카스케이딩 실패 모델을 적용하여 상호의존적인 경제 네트워크를 통해 충격이 어떻게 확산되는지 시뮬레이션한다.
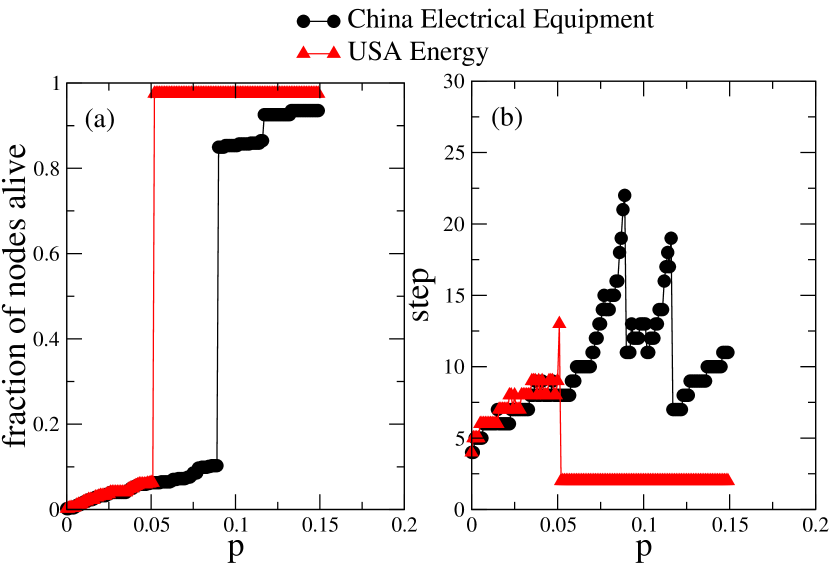
- 네트워크가 붕괴되기 전까지 견딜 수 있는 노드 비율인 내성 임계값 $p_c$를 정의하여 산업 및 국가의 회복력을 순위 매기기 위해 사용한다.
- 산업 영향력을 평가하기 위해 가상 추출 방법(Hypothetical Extraction Method, HEM)을 활용하지만, 카스케이딩 효과를 통한 체계적 리스크 평가로 확장한다.
- 산업별 $p_c$ 값을 집계하여 국가 수준의 내성 수준을 계산함으로써 체계적 중요도를 반영한다.
- 총 생산량과 $p_c$ 추세를 비교하여 경제 규모와 체계적 영향력을 분리 분석한다.
실험 결과
연구 질문
- RQ1글로벌 경제 안정성에 가장 체계적으로 중요한 산업과 국가는 무엇인가?
- RQ21995년에서 2011년 사이에 중국의 체계적 중요도는 미국 대비 어떻게 변화해 왔는가?
- RQ3국가의 총 생산량이 $p_c$로 측정된 체계적 회복력과 얼마나 관련이 있는가?
- RQ4카스케이딩 실패 현상은 상호의존적인 글로벌 경제 네트워크를 어떻게 확산하는가?
- RQ5세계 입력-출력 네트워크의 어떤 구조적 취약점이 체계적 붕괴를 유발할 수 있는가?
주요 결과
- 중국의 체계적 경제 중요도는 $p_c$로 측정되었을 때 2003년 이후 미국을 초월하여 2011년까지 지속적으로 증가했다.
- 미국의 $p_c$ 내성 수준은 총 생산량이 증가함에도 불구하고 2000년에서 2011년 사이에 감소했으며, 이는 체계적 회복력 감소를 시사한다.
- 독일의 $p_c$는 시간이 지남에 따라 상대적으로 안정되어 있었으며, 이는 일관된 체계적 영향력을 의미하지만 확대되지는 않았다.
- 중국의 상위 4개 산업의 평균 $p_c$는 1995년에서 2011년 사이에 크게 증가했으며, 이는 체계적 중요도 상승을 반영한다.
- 중국, 미국, 독일의 총 생산량은 모두 시간이 지남에 따라 증가했지만, 유일하게 중국과 독일만 생산량과 $p_c$가 동시에 증가하는 경향을 보였으며, 이는 더 강력한 체계적 영향력을 의미한다.
- 총 생산량과 $p_c$ 간의 비교를 통해 체계적 영향력은 경제 규모만으로는 유추할 수 없으며, 네트워크 기반 리스크 지표의 가치가 높다는 점을 확인할 수 있다.
더 나은 연구,지금 바로 시작하세요
논문 읽기부터 검토까지, 연구 시간을 획기적으로 줄여보세요.
카드 등록 없음 · 무료 플랜 제공
이 리뷰는 AI가 만들고, 인간 에디터가 검토했습니다.