[논문 리뷰] Studying continuous, time-varying, and/or complex exposures using longitudinal modified treatment policies
논문은 longitudinal modified treatment policies (LMTPs)를 소개합니다. 이는 시간에 따라 달라지는 복잡한 노출이나 연속 노출에 대한 통합 인과 추론 프레임워크로, 추정 전략과 lmtp R 패키지를 활용한 COVID-19 삽관 타이밍 사례 연구를 포함합니다.
This tutorial discusses methodology for causal inference using longitudinal modified treatment policies. This method facilitates the mathematical formalization, identification, and estimation of many novel parameters, and mathematically generalizes many commonly used parameters, such as the average treatment effect. Longitudinal modified treatment policies apply to a wide variety of exposures, including binary, multivariate, and continuous, and can accommodate time-varying treatments and confounders, competing risks, loss-to-follow-up, as well as survival, binary, or continuous outcomes. Longitudinal modified treatment policies can be seen as an extension of static and dynamic interventions to involve the natural value of treatment, and, like dynamic interventions, can be used to define alternative estimands with a positivity assumption that is more likely to be satisfied than estimands corresponding to static interventions. This tutorial aims to illustrate several practical uses of the longitudinal modified treatment policy methodology, including describing different estimation strategies and their corresponding advantages and disadvantages. We provide numerous examples of types of research questions which can be answered using longitudinal modified treatment policies. We go into more depth with one of these examples--specifically, estimating the effect of delaying intubation on critically ill COVID-19 patients' mortality. We demonstrate the use of the open-source R package lmtp to estimate the effects, and we provide code on https://github.com/kathoffman/lmtp-tutorial.
연구 동기 및 목표
- 연속적이고 시간에 따라 달라지는 노출이 포함된 인과 질문의 필요성을 정 static 개입을 넘어 제시합니다.
- LMTPs를 static, dynamic, stochastic, modified 개입을 포괄하는 일반 프레임워크로 제시합니다.
- 일반화된 g-공식을 통한 식별 및 양성성(positivity)과 순차 무작위 가정에 대해 설명합니다.
- 매개변수적 g-계산, IPW, TMLE, SDR 등 실용적 추정 전략(기계학습 가능성 포함)을 제시합니다.
- 입원 COVID-19 환자의 인공호흡 시작 지연이 사망률에 미치는 효과를 재현 가능한 코드와 함께 추정하는 사례 연구를 제공합니다.
제안 방법
- longitudinal modified treatment policies (LMTPs)를 정의하고 이를 통해 정책 기능이 치료의 자연스러운 값에 의존하도록 허용함으로써 정적/동적 개입을 확장하는 방법을 제시합니다.
- LMTPs 내 개입 함수 d_t를 정적, 동적, 확률적, 수정된 것으로 분류합니다.
- 양성성 및 순차적 무작위성 가정하에서 일반화된 g-공식을 통한 식별을 명시합니다.
- 추정 방법으로 매개변수적 g-계산, 역확률가중(IPW), 비모수적 기계학습 기반 방법(TMLE, SDR, iTMLE)을 설명합니다.
- 오픈소스 R 패키지 lmtp를 이용한 소프트웨어 구현 및 재현 코드와 합성 데이터 제공에 대해 논의합니다.
실험 결과
연구 질문
- RQ1LMTP 하에서 시간에 따라 변하고 복잡한 노출에 대해 어떤 인과 estimand가 정의되고 식별될 수 있는가?
- RQ2LMTP가 시간 축에서의 양성성 위반과 정보손실(censoring)을 어떻게 다룰 수 있는가?
- RQ3LMTP 내에서 추정 전략(g-계산, IPW, TMLE, SDR)의 특성과 트레이드오프는 무엇인가?
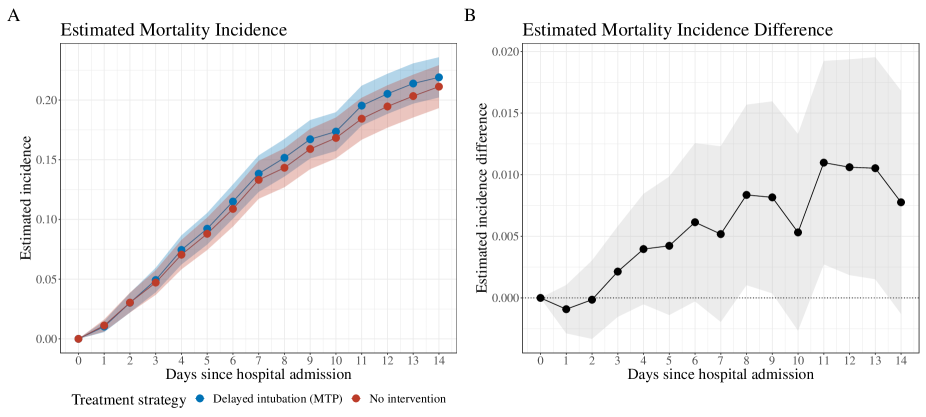
- RQ4COVID-19 환자에서 인공호흡 연기의 지연이 LMTP 가정하에서 14일 사망률에 어떤 영향을 미치는가?
주요 결과
- LMTPs는 시간에 따라 변하고 연속적이거나 다중 노출 상황을 포함한 광범위한 노출과 결과에 대한 인과 효과를 정의, 식별, 추정하는 단일한 방법을 제공한다.
- 양성성 문제는 관찰된 지지선 내에서 개입을 설계함으로써 완화될 수 있으며, 구조적 위반과 실용적 위반에 대한 논의가 포함된다.
- 비모수 추정기(TMLE, SDR, iTMLE)는 유연한 모델링과 타당한 불확실성 및 이중 강건성 속성을 제공하며, 기계학습을 활용할 수 있다.
- COVID-19 사례 연구에서 아무 개입이 없는 경우 14일 사망률은 0.211(95% CI 0.193–0.229)였고, 1일 지연된 삽관 LMTP 하에서는 0.219(95% CI 0.202–0.236)였다.
더 나은 연구,지금 바로 시작하세요
연구 설계부터 논문 작성까지, 연구 시간을 획기적으로 줄여보세요.
카드 등록 없음 · 무료 플랜 제공
이 리뷰는 AI가 만들고, 인간 에디터가 검토했습니다.