
[论文解读] The disruption index is biased by citation inflation
本文表明,引用膨胀(由更长的参考文献列表和自引率上升驱动)系统性地导致破坏指数(CD)产生偏差,使其随时间错误地持续下降。作者指出,这种偏差使跨时间比较失效,并提出政策干预措施(如限制参考文献列表长度)以稳定评价指标。
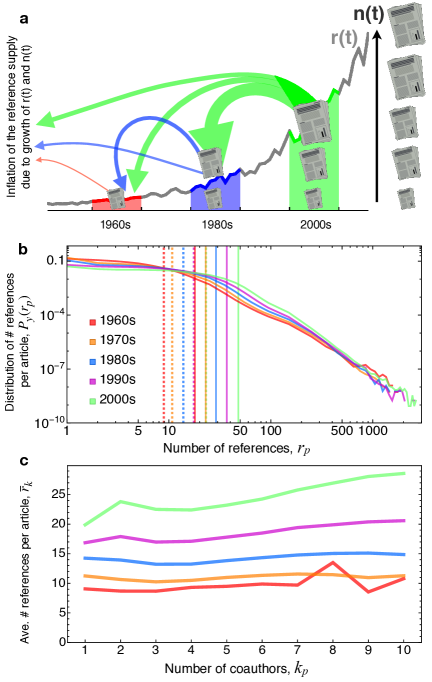
A recent analysis of scientific publication and patent citation networks by Park et al. (Nature, 2023) suggests that publications and patents are becoming less disruptive over time. Here we show that the reported decrease in disruptiveness is an artifact of systematic shifts in the structure of citation networks unrelated to innovation system capacity. Instead, the decline is attributable to 'citation inflation', an unavoidable characteristic of real citation networks that manifests as a systematic time-dependent bias and renders cross-temporal analysis challenging. One driver of citation inflation is the ever-increasing lengths of reference lists over time, which in turn increases the density of links in citation networks, and causes the disruption index to converge to 0. A second driver is attributable to shifts in the construction of reference lists, which is increasingly impacted by self-citations that increase in the rate of triadic closure in citation networks, and thus confounds efforts to measure disruption, which is itself a measure of triadic closure. Combined, these two systematic shifts render the disruption index temporally biased, and unsuitable for cross-temporal analysis. The impact of this systematic bias further stymies efforts to correlate disruption to other measures that are also time-dependent, such as team size and citation counts. In order to demonstrate this fundamental measurement problem, we present three complementary lines of critique (deductive, empirical and computational modeling), and also make available an ensemble of synthetic citation networks that can be used to test alternative citation-based indices for systematic bias.
研究动机与目标
- 识别并诊断科学引文网络中因引用膨胀导致的破坏指数(CD)系统性偏差。
- 证明CD随时间的下降趋势是引文网络结构变化的产物,而非科学破坏性实际降低的反映。
- 质疑在研究评价中使用CD进行跨时间比较的有效性,尤其是在其与团队规模或引文数量等时间依赖变量相关时。
- 提出政策干预措施(如限制参考文献列表长度),以减轻引用膨胀并稳定文献计量指标。
- 提供合成引文网络,用于测试替代性、抗偏差的基于引文的指数。
提出的方法
- 对破坏指数的数学结构进行演绎式批判,识别参考文献列表长度(r_p)增加以及自引带来的三角闭合如何引入时间依赖性偏差。
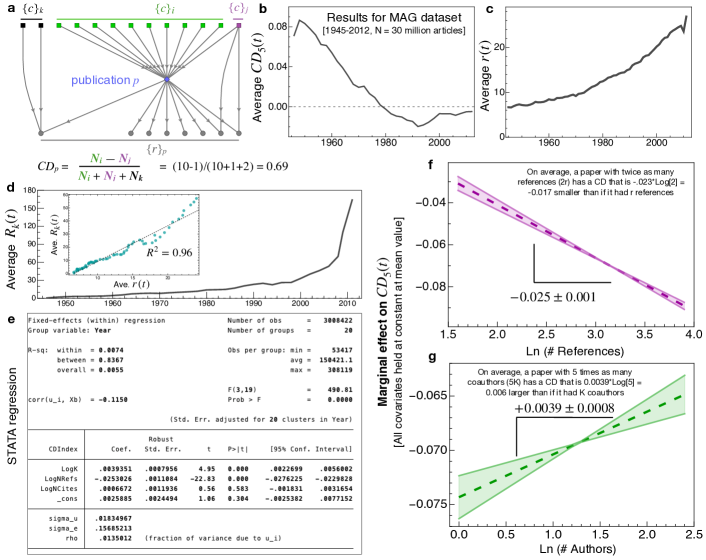
- 基于真实引文网络(如Microsoft Academic Graph)进行实证分析,显示r_p和引文数量随时间上升,且与CD值下降相关。
- 通过计算建模模拟在不同参数(如r_p增长、自引率)下的引文网络增长,证明CD因引用膨胀而趋于零。
- 使用带出版年份固定效应的回归模型,评估CD与团队规模(k_p)等变量的关系,揭示因时间混杂导致的虚假相关性。
- 开发并发布一组合成引文网络(DryadDisruption2023),以支持对替代性、抗偏差文献计量指数的测试。
- 引入政策模拟框架,评估参考文献列表长度限制对减轻引用膨胀影响的效果。
实验结果
研究问题
- RQ1破坏指数(CD)随时间的观测下降在多大程度上反映了科学创新的实际变化,还是引用膨胀导致的产物?
- RQ2参考文献列表长度增加和自引率上升在多大程度上导致了破坏指数的时间偏差?
- RQ3鉴于引文网络的结构随时间发生动态变化,破坏指数能否可靠地用于研究评价中的跨时间比较?
- RQ4哪些政策干预措施(如参考文献列表长度限制)能有效减少引用膨胀并稳定文献计量指标?
- RQ5时间依赖性混杂变量(如团队规模和引文数量)如何与破坏指数相互作用,对因果推断有何影响?
主要发现
- 由于引用膨胀,破坏指数(CD)随时间系统性地产生偏差,其下降并非反映科学破坏性的降低,而是引文网络结构变化的结果。
- 仅参考文献列表长度(r_p)的增长就显著贡献于引用膨胀,Web of Science网络的总引文量年均增长5.1%(g_C = g_n + g_r = 0.033 + 0.018)。
- 由于网络密度增加和三角闭合(尤其是自引导致)的增强,破坏指数随时间趋于零,这使整合度(N_j)被高估,从而扭曲了破坏性(CD_p)的测量。
- 实证分析显示CD_p与团队规模(k_p)呈正相关,与先前报告的负相关关系相矛盾,表明时间依赖性混杂因素使因果推断失效。
- 计算模拟表明,限制参考文献列表(尤其是基于每页文章数量的软性上限)能有效减少引用膨胀并稳定评价指标。
- 作者发布了合成引文网络集合(DryadDisruption2023),以支持对替代性、抗偏差文献计量指数的测试。
更好的研究,从现在开始
从阅读论文到最终审阅,大幅缩短您的研究时间。
无需绑定信用卡
本解读由 AI 生成,并经人工编辑审核。