[論文レビュー] A Cross-Domain Approach to Analyzing the Short-Run Impact of COVID-19 on the U.S. Electricity Sector
この論文は COVID-EMDA + を紹介し、電力市場データと COVID-19 の健康・モビリティ・衛星データを統合するクロスドメインデータハブで、Restricted VAR モデルを用いて米国の市場間の電力消費に対する COVID-19 の短期的影響を定量化します。
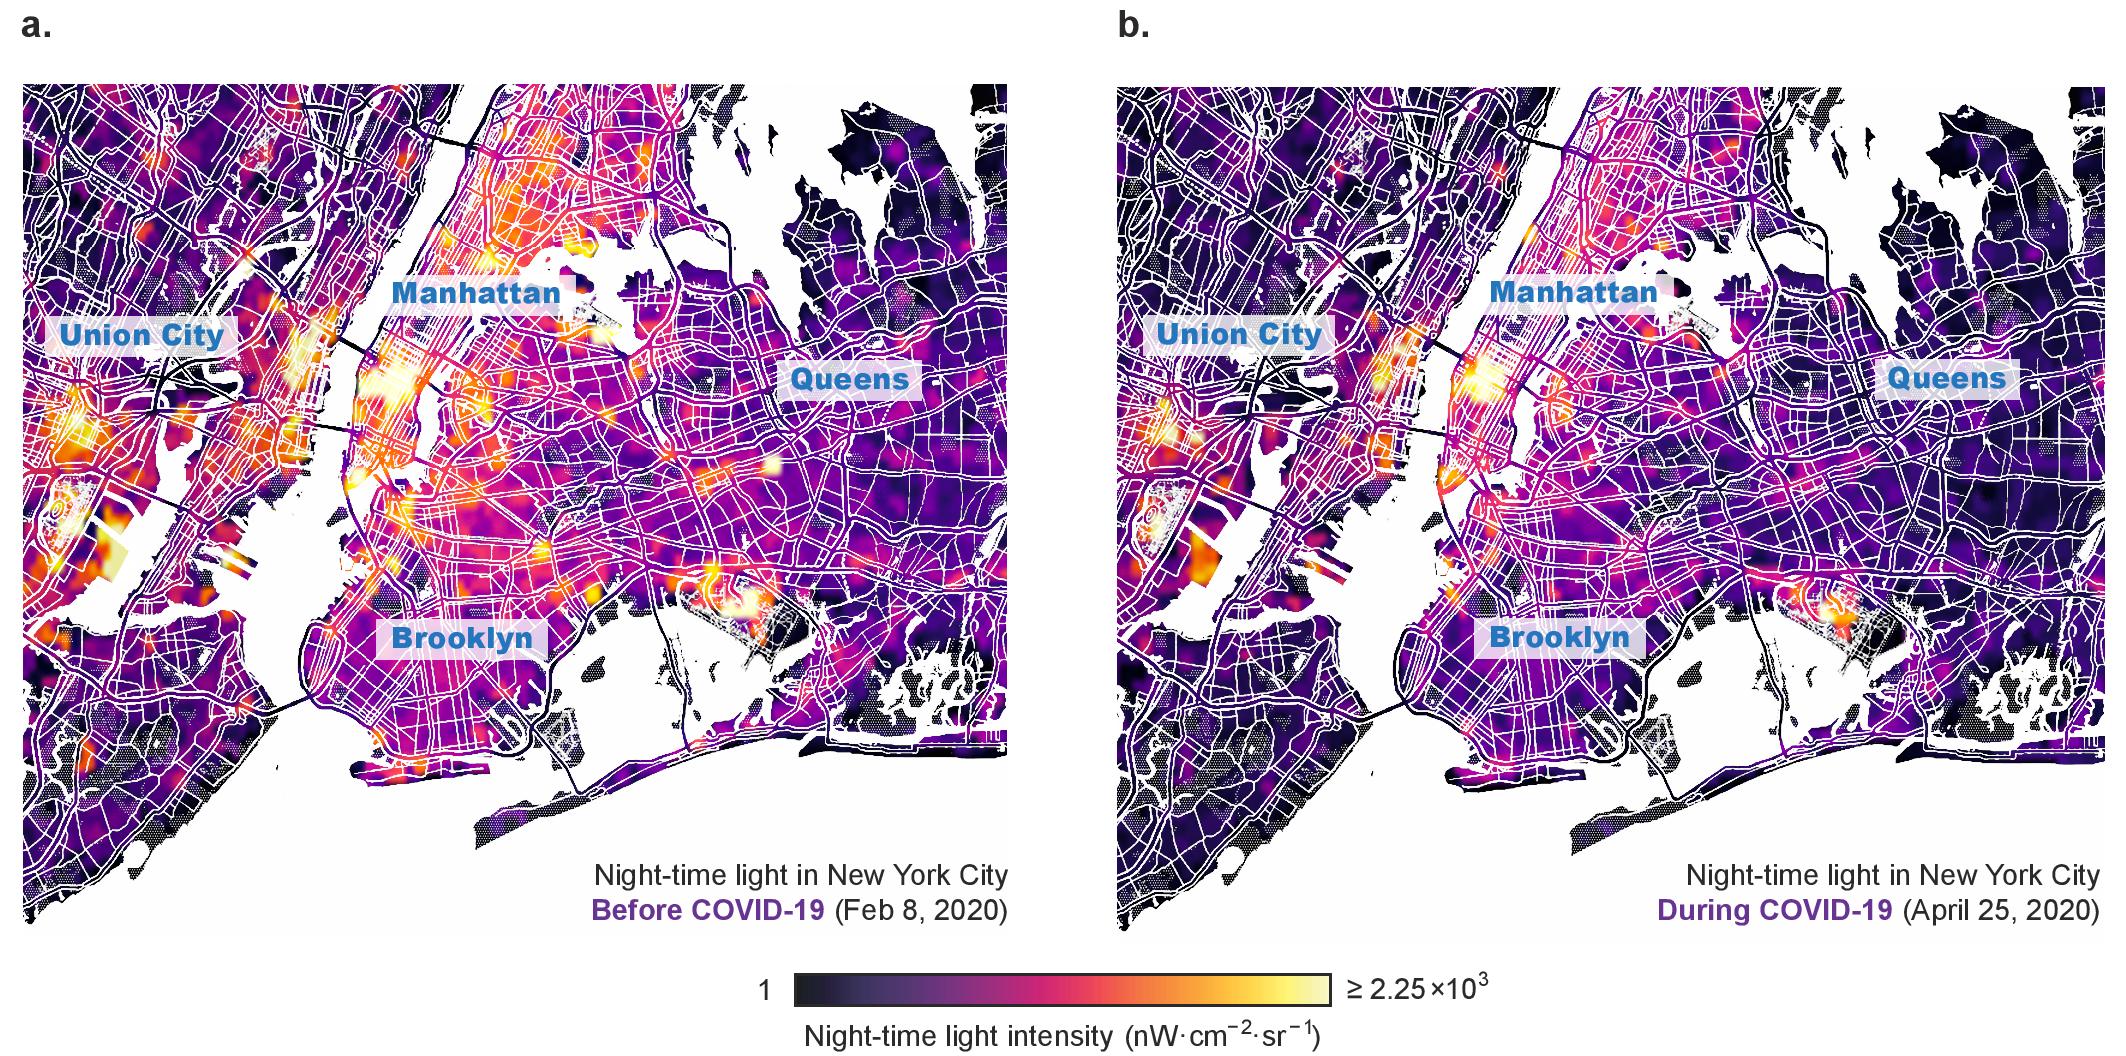
The novel coronavirus disease (COVID-19) has rapidly spread around the globe in 2020, with the U.S. becoming the epicenter of COVID-19 cases since late March. As the U.S. begins to gradually resume economic activity, it is imperative for policymakers and power system operators to take a scientific approach to understanding and predicting the impact on the electricity sector. Here, we release a first-of-its-kind cross-domain open-access data hub, integrating data from across all existing U.S. wholesale electricity markets with COVID-19 case, weather, cellular location, and satellite imaging data. Leveraging cross-domain insights from public health and mobility data, we uncover a significant reduction in electricity consumption across that is strongly correlated with the rise in the number of COVID-19 cases, degree of social distancing, and level of commercial activity.
研究の動機と目的
- クロスドメイン分析の必要性を動機づけ、COVID-19 が電力需要に与える影響を評価する。
- 電力市場を健康、モビリティ、天候、衛星データと統合したオープンアクセスデータハブ(COVID-EMDA +)を作成する。
- クロスドメイン指標に対して電力消費の変化を定量化する統計的枠組みを開発する。
- 地域別および都市別の削減を定量化し、負荷変動の主要な推進因子を特定する。
提案手法
- 電力市場、天候、COVID-19 症例データ、モビリティ(SafeGraph)、衛星画像データを統合するオープンアクセスデータハブ COVID-EMDA + を構築する。
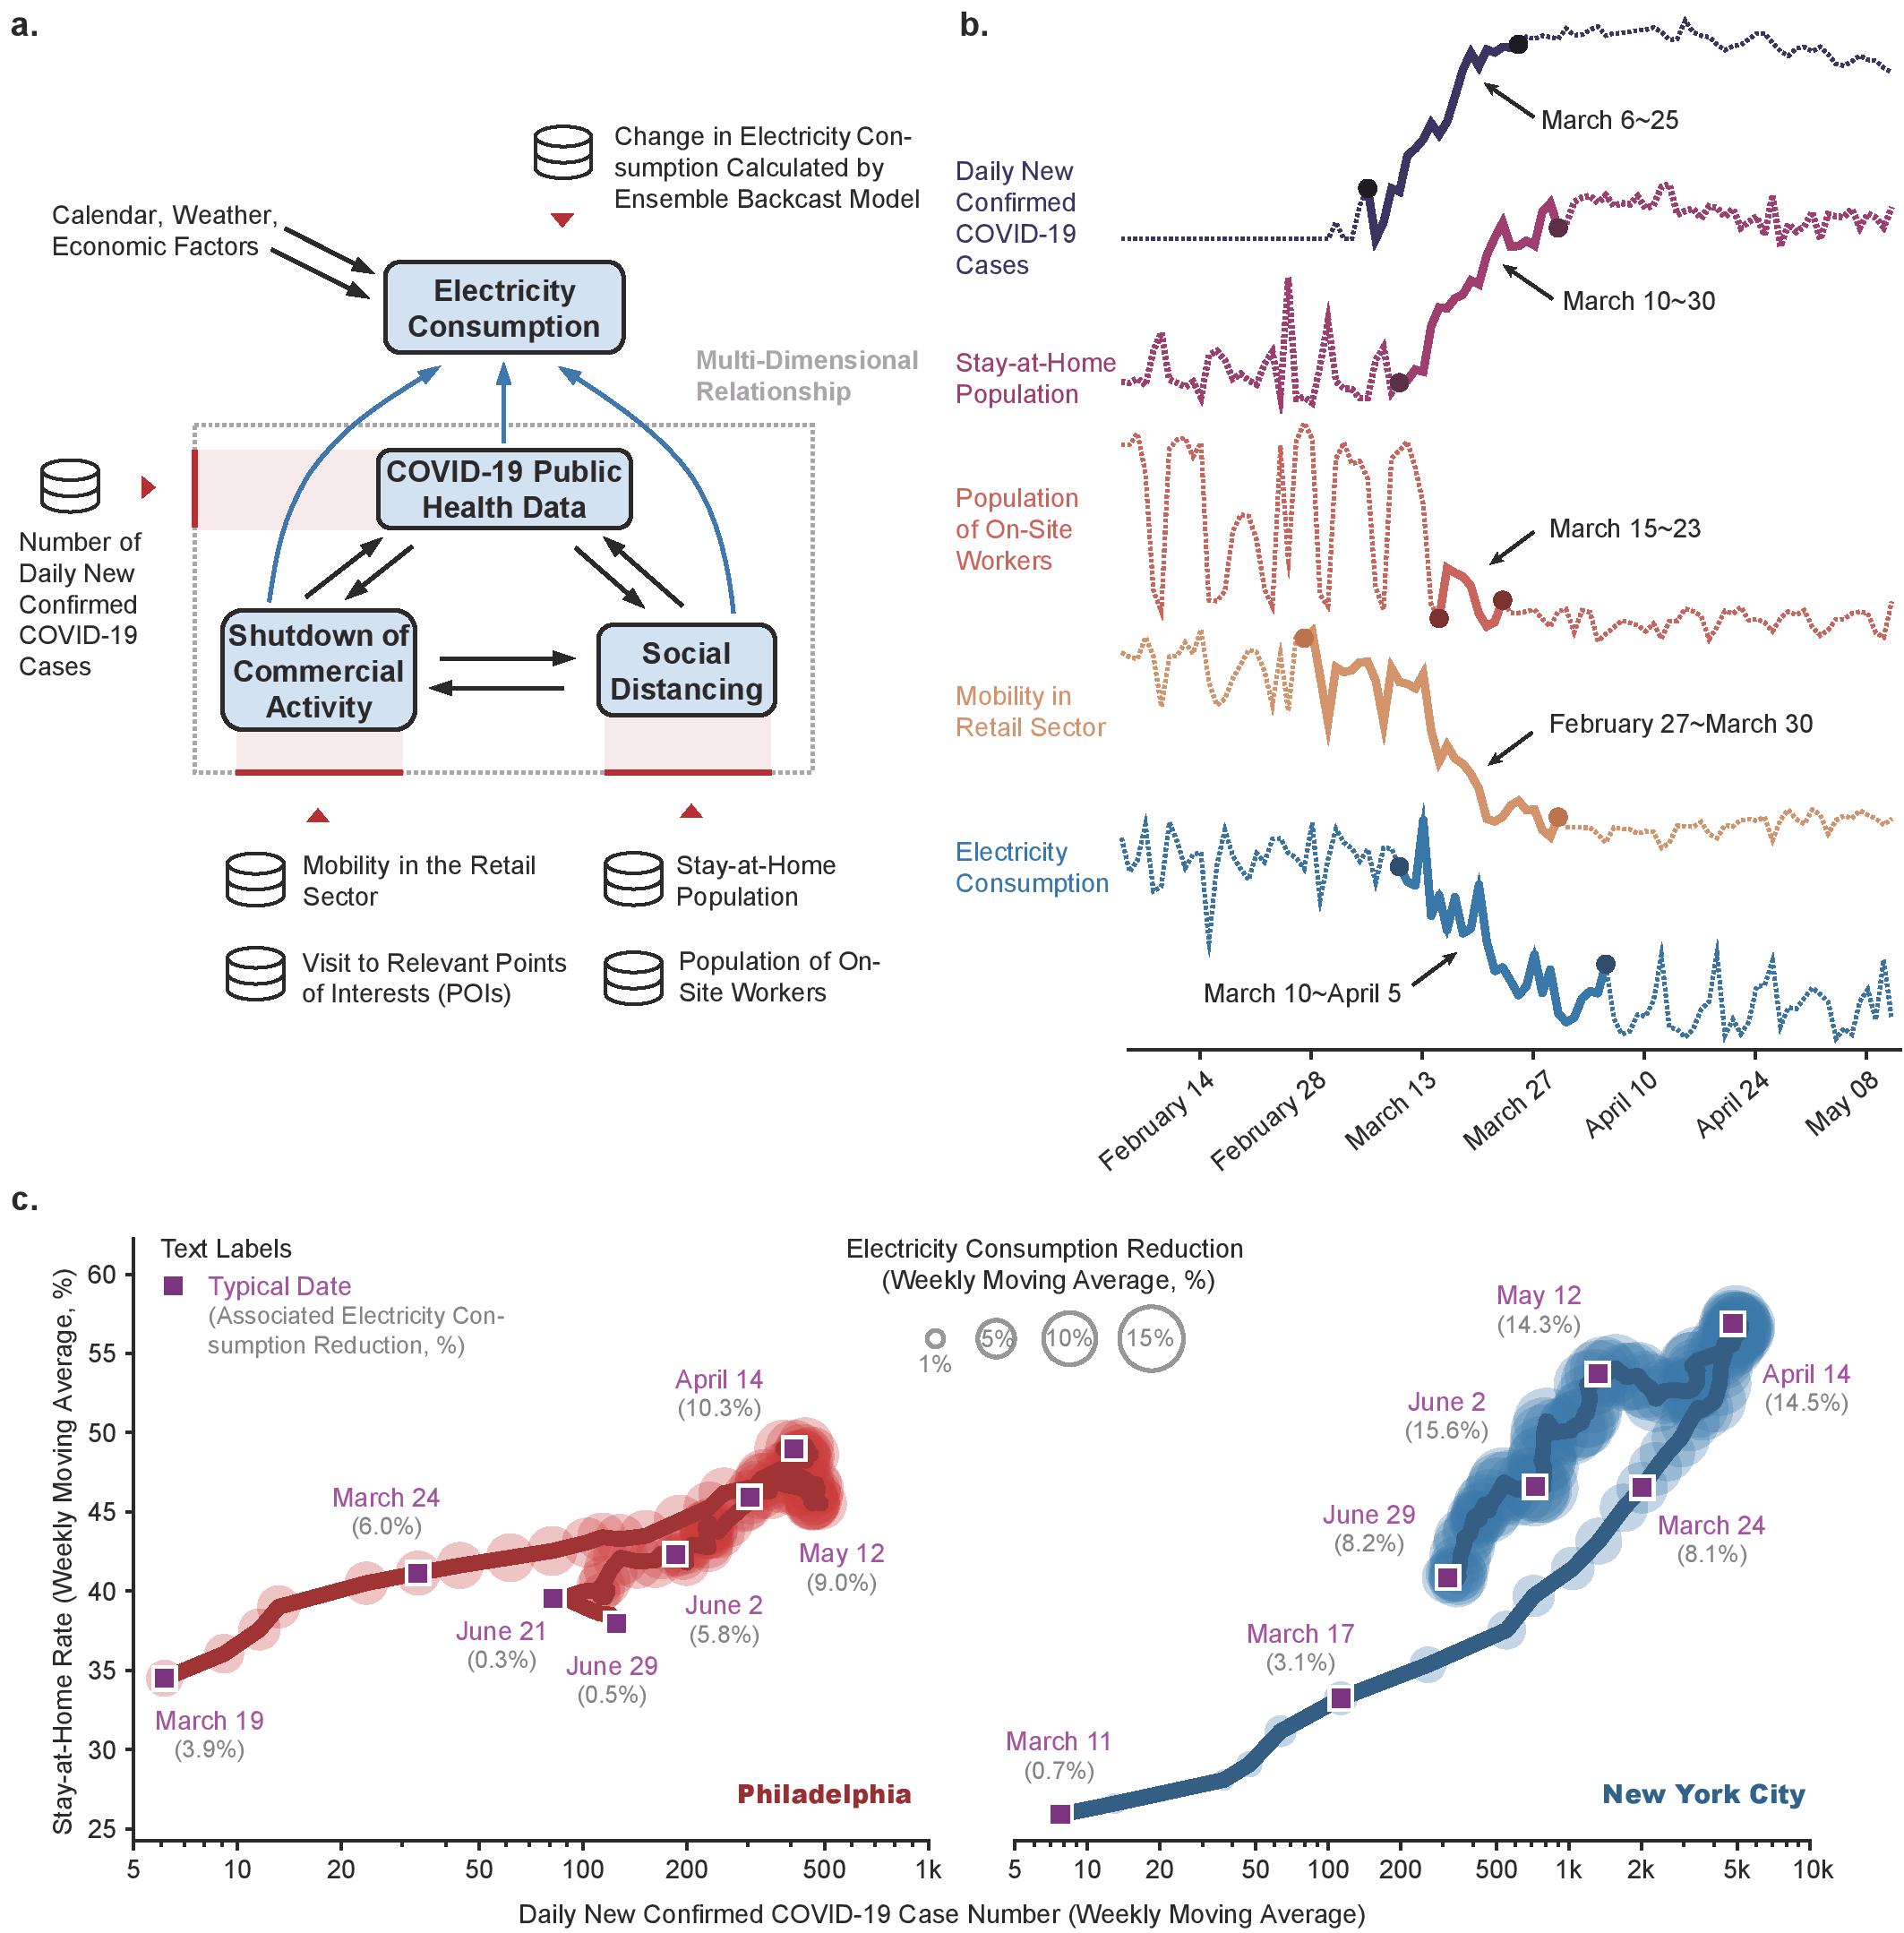
- 天気、カレンダー、GDP成長要因を考慮した COVID 前の電力消費を推定するアンサンブルバックキャストモデルを開発する。
- 電力消費に対する多要因の影響を分析するための都市別 Restricted Vector Autoregression (VAR) モデルをキャリブレーションし、分散分解とインパルス応答分析を実行する。
- データソースを地理的・時間的解像度に合わせるための地理コード化とデータ調和を行う。
- クロス市場およびクロス都市の電力消費削減(2020年4月–6月)を評価し、クロスドメイン因子と関連付ける。
実験結果
リサーチクエスチョン
- RQ1COVID-19、社会的距離の実施、リテールモビリティは市場や都市を跨いだ米国の電力消費の変化とどう関連するか?
- RQ2公衆衛生指標、社会的距離の指標、商業活動の相対的重要性は負荷削減の説明においてどれほど重要か?
- RQ3因子間の動的な時系列スケールの差(トップダウン対ボトムアップの応答)は電力消費に遅延効果を生むか?
- RQ4クロスドメインデータはパンデミック時の短期負荷予測と政策評価を改善できるか?
主な発見
| 市場/都市 | 2月 | 3月 | 4月 | 5月 | 6月 |
|---|---|---|---|---|---|
| CAISO | -1.31 | 2.68 | 9.24 | 6.46 | 0.29 |
| MISO | -0.14 | 1.77 | 10.24 | 10.71 | 3.49 |
| ISO-NE | 2.15 | 5.24 | 9.47 | 10.44 | 1.79 |
| NYISO | 0.84 | 4.51 | 10.20 | 10.47 | 5.72 |
| PJM | 0.54 | 2.68 | 9.44 | 7.35 | 0.14 |
| SPP | -0.90 | 2.47 | 7.72 | 9.24 | 2.66 |
| ERCOT | -1.52 | 1.30 | 6.36 | 4.44 | 2.41 |
| Boston | 0.40 | 7.12 | 11.32 | 9.36 | 0.41 |
| Chicago | 0.09 | 2.95 | 9.81 | 9.51 | 3.24 |
| Houston | -0.55 | -0.53 | 5.33 | 3.63 | 4.41 |
| Kansas City | 0.10 | 0.24 | 9.04 | 7.01 | 0.21 |
| Los Angeles | -1.12 | 3.32 | 11.06 | 3.91 | -1.90 |
| New York City | 0.43 | 5.27 | 14.10 | 14.77 | 11.07 |
| Philadelphia | 0.75 | 3.94 | 8.93 | 8.24 | 2.07 |
- すべての米国の電力市場は2020年4月と5月に削減を示し、4月は6.36%〜10.24%、5月は4.44%〜10.71%であった。
- NYISOとMISOが最大の削減を経験した一方で、ERCOTとSPPはより小さな削減を示した。
- 小売モビリティ(商業活動)は都市全体で負荷削減に最も重要かつ堅牢な要因であり、各市場で感度が定量化されている(例:Houston:1%の小売モビリティ低下は約0.78%の定常状態負荷低下に相当)。
- 新規COVID-19症例数はインパルス応答における消費への直接的影響が弱いことを示唆しており、社会的距離と商業活動を通じた間接効果を示唆する。
- 都市レベルの分析では、NYCやボストンのような密集した都市部がヒューストンのような分散した地域よりも大きな削減を被った。
- クロスドメインの洞察は地域ごとに異なるダイナミクスを明らかにし、政策と運用の意思決定には場所適合的な分析が必要であることを示している。
より良い研究を、今すぐ始めましょう
論文設計から論文執筆まで、研究時間を劇的に削減しましょう。
クレジットカード登録不要
このレビューはAIが作成し、人間の編集者が確認しました。