
[論文レビュー] Agri-GNN: A Novel Genotypic-Topological Graph Neural Network Framework Built on GraphSAGE for Optimized Yield Prediction
Agri-GNN は、農業用の畝をグラフ内のノードとして表現し、空間的および遺伝的類似性によってエッジを定義する、GraphSAGEに基づく新しいグラフニューラルネットワークフレームワークである。アイオワの現実のフィールドデータにおいて、収量予測で R² = 0.876 を達成し、従来のベースラインモデルを著しく上回り、マルチモodalな農業データにおける複雑な遺伝的・トポロジカルな相互作用を捉えている。
Agriculture, as the cornerstone of human civilization, constantly seeks to integrate technology for enhanced productivity and sustainability. This paper introduces $ extit{Agri-GNN}$, a novel Genotypic-Topological Graph Neural Network Framework tailored to capture the intricate spatial and genotypic interactions of crops, paving the way for optimized predictions of harvest yields. $ extit{Agri-GNN}$ constructs a Graph $\mathcal{G}$ that considers farming plots as nodes, and then methodically constructs edges between nodes based on spatial and genotypic similarity, allowing for the aggregation of node information through a genotypic-topological filter. Graph Neural Networks (GNN), by design, consider the relationships between data points, enabling them to efficiently model the interconnected agricultural ecosystem. By harnessing the power of GNNs, $ extit{Agri-GNN}$ encapsulates both local and global information from plants, considering their inherent connections based on spatial proximity and shared genotypes, allowing stronger predictions to be made than traditional Machine Learning architectures. $ extit{Agri-GNN}$ is built from the GraphSAGE architecture, because of its optimal calibration with large graphs, like those of farming plots and breeding experiments. $ extit{Agri-GNN}$ experiments, conducted on a comprehensive dataset of vegetation indices, time, genotype information, and location data, demonstrate that $ extit{Agri-GNN}$ achieves an $R^2 = .876$ in yield predictions for farming fields in Iowa. The results show significant improvement over the baselines and other work in the field. $ extit{Agri-GNN}$ represents a blueprint for using advanced graph-based neural architectures to predict crop yield, providing significant improvements over baselines in the field.
研究の動機と目的
- 農業データにおける複雑な関係的相互作用を捉えることが難しい従来の機械学習モデルの限界を克服すること。
- 遺伝的、空間的、時系列的、環境的データを統合し、一元的な予測フレームワークを構築すること。
- 遺伝的および空間的類似性に基づいて、畝を相互に接続されたノードとしてモデル化することで、収量予測の精度を向上させること。
- 精密農業および気候変動に強い農業に適した、スケーラブルでモジュール型かつ適応可能なフレームワークを開発すること。
- グラフベースの学習を用いて、実世界の農業データセットにおいて既存のモデルを上回る性能を示すこと。
提案手法
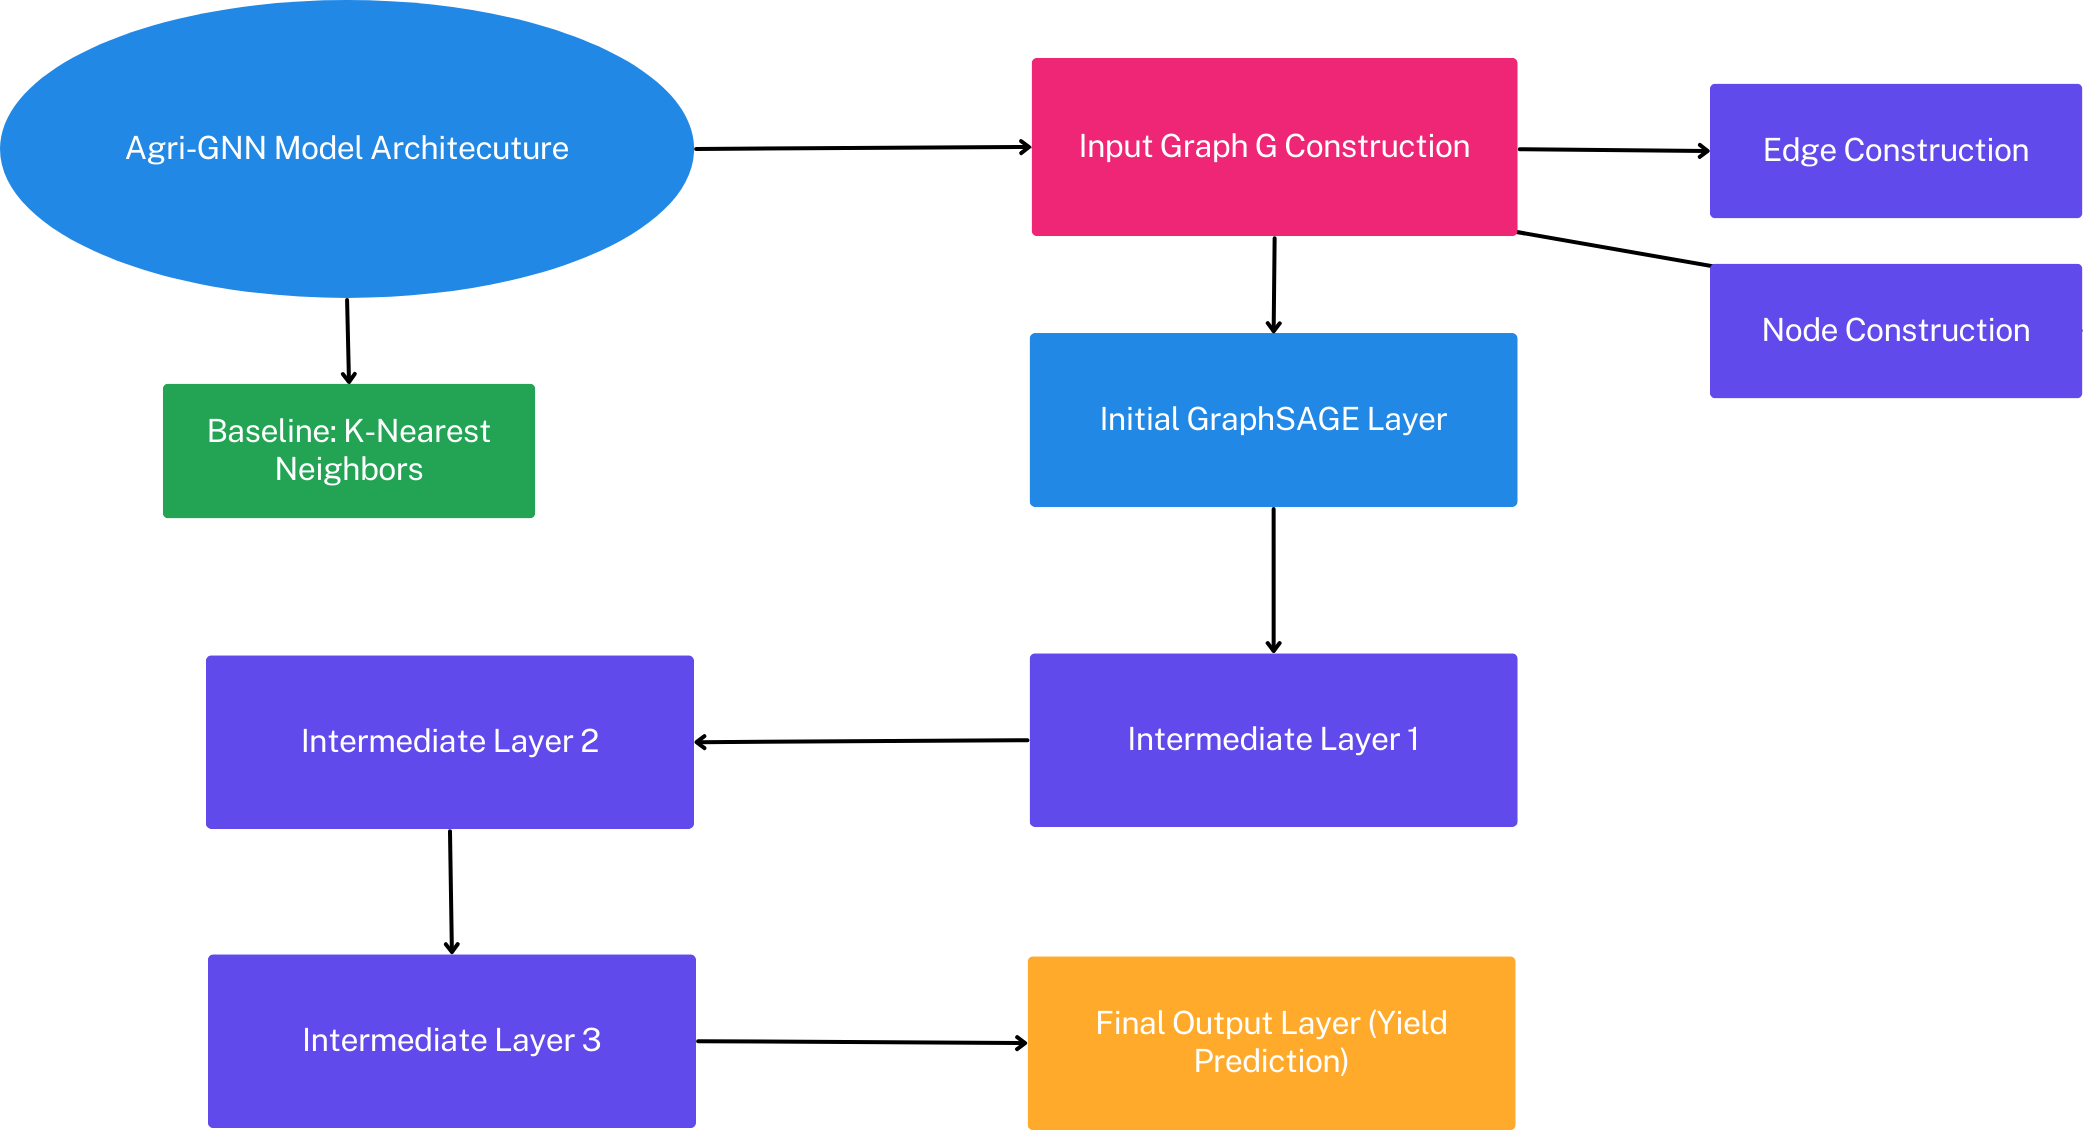
- 各畝をノードとするグラフ 𝒢 を構築し、エッジは空間的近接性と遺伝的類似性に基づいて形成する。
- ノード特徴量の集約に、関連性の高い類似した近隣ノードに焦点を当てる遺伝的・トポロジカルフィルタを適用し、ノイズを低減する。
- 推論時に未観測の畝に対しても一般化可能なノード埋め込みを生成するために、GraphSAGE の誘導学習フレームワークを活用する。
- 生育指標、時刻、遺伝子型、位置などの多様なデータモダリティを、統一されたグラフ構造化表現に統合する。
- ラベル付きの収量データを用いてエンドツーエンドで学習し、RMSE、MAE、R² の指標を最適化する。
- 学習済みのノード埋め込みを可視化するための t-SNE を用いて、類似した畝が意味的に整合的にクラスタリングされているかを検証する。
実験結果
リサーチクエスチョン
- RQ1空間的および遺伝的関係をモデル化するグラフニューラルネットワークは、従来の機械学習モデルと比較して、作物の収量予測精度を向上させることができるか?
- RQ2限られたラベル付き例しか存在しない大規模で異種の農業データセットに対して、GraphSAGE を用いた誘導学習がどの程度効果的に適用可能か?
- RQ3遺伝的、空間的、時系列的、環境的データを統合することで、収量予測性能がどの程度向上するか?
- RQ4学習済みのノード埋め込みは、生物学的および空間的要因に基づく意味のある畝のグループ化をどの程度反映しているか?
- RQ5Agri-GNN フレームワークは、最小限のファインチューニングで、新しい未観測の畝に一般化できるか?
主な発見
- Agri-GNN は、アイオワ州エイムズの現実のフィールドデータにおいて、収量予測で R² = 0.876 を達成し、ベースラインモデルを著しく上回った。
- 同じデータセットおよび評価設定において、Chattopadhyay ら (2023) の先行研究よりも優れた性能を示した。
- 学習済み埋め込みの t-SNE 視覚化により、遺伝的および空間的類似性に基づく一貫性のあるクラスタリングが確認され、モデルが意味のある関係性を捉えていることが裏付けられた。
- 遺伝的・トポロジカルフィルタの活用により、特徴量集約のノイズが低減し、より頑健で正確な予測が可能になった。
- Agri-GNN の誘導学習機能により、新しい未観測の畝に対しても効果的な一般化が可能であり、スケーラビリティと適応性の高さが示された。
- フレームワークはデータのばらつきや不確実性に対しても強く、多様な現実の畝の状況において一貫した性能を維持した。
より良い研究を、今すぐ始めましょう
論文の読解から最終レビューまで、研究時間を劇的に削減しましょう。
クレジットカード登録不要
このレビューはAIが作成し、人間の編集者が確認しました。