
[論文レビュー] Broad Absorption Line Quasars in the Dark Energy Spectroscopic Instrument Early Data Release
本論文は、自動化された検出手法を用いてDark Energy Spectroscopic Instrument (DESI) Early Data Releaseで同定された広帯域吸収線(BAL)クェーサーのカタログを提示する。BAL吸収特徴をマスクし、再計算した赤方偏移により、平均赤方偏移誤差を243 km s⁻¹低減した。これにより、クェーサークラスタリング測定が著しく改善され、宇宙論的解析が向上したが、BALは歴史的に汚染要因と見なされてきた。
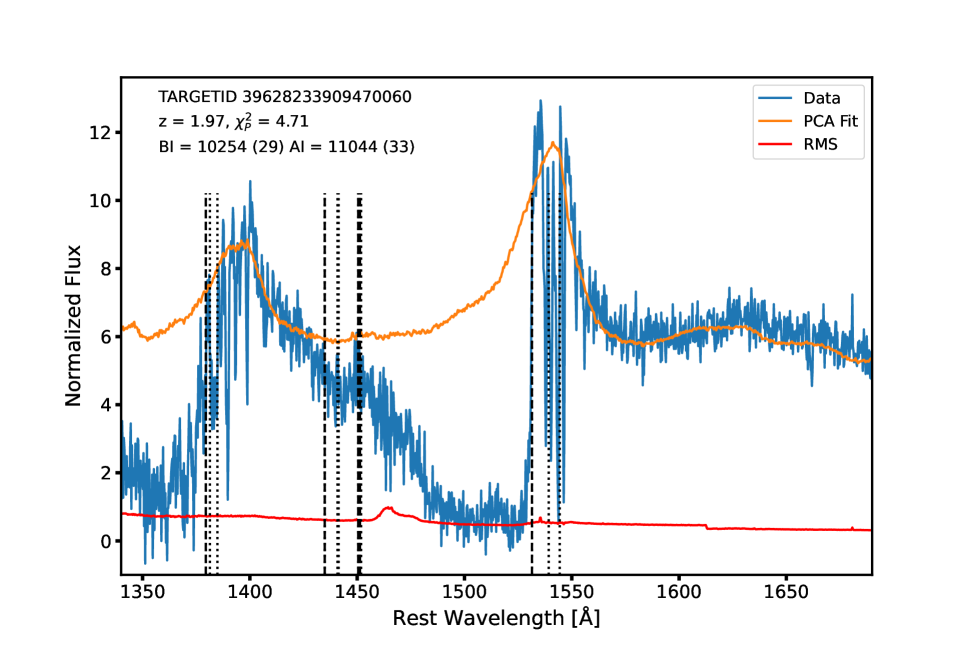
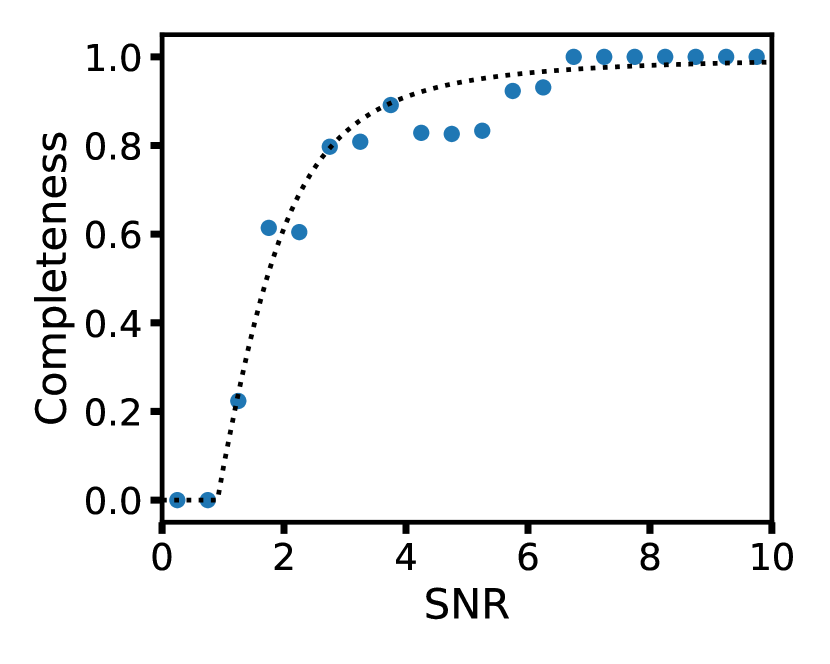
Broad absorption line (BAL) quasars are characterized by gas clouds that absorb flux at the wavelength of common quasar spectral features, although blueshifted by velocities that can exceed 0.1c. BAL features are interesting as signatures of significant feedback, yet they can also compromise cosmological studies with quasars by distorting the shape of the most prominent quasar emission lines, impacting redshift accuracy and measurements of the matter density distribution traced by the Lyman-alpha forest. We present a catalog of BAL quasars discovered in the Dark Energy Spectroscopic Instrument (DESI) survey Early Data Release, which were observed as part of DESI Survey Validation, as well as the first two months of the main survey. We describe our method to automatically identify BAL quasars in DESI data, the quantities we measure for each BAL, and investigate the completeness and purity of this method with mock DESI observations. We mask the wavelengths of the BAL features and re-evaluate each BAL quasar redshift, finding new redshifts which are 243 km/s smaller on average for the BAL quasar sample. These new, more accurate redshifts are important to obtain the best measurements of quasar clustering, especially at small scales. Finally, we present some spectra of rarer classes of BALs that illustrate the potential of DESI data to identify such populations for further study.
研究の動機と目的
- DESI Early Data Releaseにおけるスペクトルを用いた自動スペクトル解析により、広帯域吸収線(BAL)クェーサーを同定すること。
- BAL特徴がクェーサー赤方偏移測定およびクラスタリング研究に与える汚染の問題を解決すること。
- C iv、Si iv、N v、およびLyα線におけるBAL吸収トロフをマスクすることで、赤方偏移の正確性を向上させること。
- BALが宇宙論的調査に与える影響を定量化し、過去の除外にもかかわらずその科学的価値を評価すること。
- BALマスク後の赤方偏移補正により、大規模構造測定をより正確に行えるようにすること。
提案手法
- C iv、Si iv、N v、およびLyα発光線における吸収特徴に基づき、自動アルゴリズムを用いてDESIスペクトル内のBALクェーサーを検出する。
- BAL検出手法の完全性および純度を評価するために、模擬DESI観測を用いる。
- C iv、Si iv、N v、およびLyα領域におけるBALトロフに対応する波長をマスクし、クェーサー赤方偏移を再計算する。
- マスク前後での赤方偏移を比較し、系統的シフトと誤差低減を定量化する。
- 元の赤方偏移と補正後の赤方偏移の平均速度シフトを計算し、正確性の向上を評価する。
- カタログの完全性および代表的サンプルに基づき、全DESI調査におけるBAL割合を予測する。
実験結果
リサーチクエスチョン
- RQ1DESI Early Data ReleaseにおけるBALクェーサーの割合はどの程度で、過去の調査と比較してどう異なるか?
- RQ2BAL吸収特徴はクェーサー赤方偏移測定にどのように影響を与え、その誤差はどの程度補正可能か?
- RQ3BAL特徴のマスクがクェーサー赤方偏移およびクラスタリング測定の正確性に与える影響は何か?
- RQ4BALクェーサーの信号対雑音比(SNR)は非BALクェーサーと比較してどうか?また、宇宙論的解析にどのような影響を及えるか?
- RQ5BALクェーサーを宇宙論的調査に残すことで、統計的パワーを高めつつデータ品質を損なわずに済ませられるか?
主な発見
- BAL特徴をマスクした後の平均赤方偏移シフトは243 km s⁻¹であり、元の赤方偏移推定値に対する顕著な補正であることが示された。
- 代表的カタログ解析に基づき、全DESI調査におけるBAL割合は約19%と予測された。
- BAL特徴をマスクすることで、非BALクェーサーと同等の赤方偏移誤差にまで低減され、模擬クェーサー研究で確認された。
- BALクェーサーは非BALクェーサー(SNR ≈ 3)と比較して平均的に高い信号対雑音比(SNR ≈ 5/ピクセル)を示し、データ品質が向上した。
- BALクェーサーを宇宙論的解析に残すことで、統計的パワーが向上し、Lyαフォレストを探索する視線数が増加した。
- 一部のケースでは、マスク後の速度シフトが1000 km s⁻¹を超えることがあり、未補正の場合は深刻な赤方偏移誤差を引き起こす可能性があることが示された。
より良い研究を、今すぐ始めましょう
論文の読解から最終レビューまで、研究時間を劇的に削減しましょう。
クレジットカード登録不要
このレビューはAIが作成し、人間の編集者が確認しました。