[論文レビュー] D4: Improving LLM Pretraining via Document De-Duplication and Diversification
本論文は D4 を導入します。データ選択手法は SemDeDup の重複除去とクラスタリングベースの多様化を組み合わせ、LLMのプレトレーニング効率と下流の精度を向上させ、モデル規模が最大で 6.7B パラメータまでの利点を示します。
Over recent years, an increasing amount of compute and data has been poured into training large language models (LLMs), usually by doing one-pass learning on as many tokens as possible randomly selected from large-scale web corpora. While training on ever-larger portions of the internet leads to consistent performance improvements, the size of these improvements diminishes with scale, and there has been little work exploring the effect of data selection on pre-training and downstream performance beyond simple de-duplication methods such as MinHash. Here, we show that careful data selection (on top of de-duplicated data) via pre-trained model embeddings can speed up training (20% efficiency gains) and improves average downstream accuracy on 16 NLP tasks (up to 2%) at the 6.7B model scale. Furthermore, we show that repeating data intelligently consistently outperforms baseline training (while repeating random data performs worse than baseline training). Our results indicate that clever data selection can significantly improve LLM pre-training, calls into question the common practice of training for a single epoch on as much data as possible, and demonstrates a path to keep improving our models past the limits of randomly sampling web data.
研究の動機と目的
- LLM プレトレーニングにおける単純な重複除去を超えたデータ選択の動機付けと、効率と性能の向上。
- 埋め込みベースの戦略を検討し、重複に起因するクラスタリングを低減し、訓練データを多様化する方法を模索。
- 固定計算予算とデータ制約下で複数のモデルスケールにおける効率と性能の向上を定量化。
- 最大限のデータセットを1エポックで学習するのが常に最適という考えに挑戦。
提案手法
- 文書を125Mパラメータモデルを用いて最終トークンの埋め込みを取得。
- SemDeDup を適用して埋め込み空間の近似重複を除去。
- Deduplicated データを K-means でクラスタリングし、SSL Prototypes を適用して多様なサンプルを選択。
- D4 を提案します。重複除去と多様化を組み合わせ、全体の選択比 R = R_dedup * R_proto。
- 固定計算とデータ制約下で 1.3B および 6.7B パラメータの OPT モデルを 40B–100B トークンまで学習させ、評価。
- 効率向上と下流の性能を 16 の NLP タスクと perplexity 指標で算出。
実験結果
リサーチクエスチョン
- RQ1埋め込みベースのデータ選択(SemDeDup と多様化)は、LLM の事前学習の効率をランダムサンプリングや単純な重複除去より改善するか。
- RQ2二段階選択(重複除去→クラスタリングベースの多様化)は、重複に起因するクラスタリング問題を緩和し、 perplexity と下流の精度を改善するか。
- RQ3固定計算とデータ制約下で、モデルサイズとトークン予算はデータ選択の利得をどうスケールさせるか。
- RQ4ウェブスナップショット検証セットと非ウェブスナップショット検証セットのデータ選択のトレードオフは。
主な発見
| S | T_total | T_selected | Epochs | Non-Web Snapshot PPL | Instruction + Answers PPL |
|---|---|---|---|---|---|
| Random | 40B | 40B | 1 | 16.27±0.012 | 14.19±0.003 |
| 40B | 20B | 2 | 16.39±0.011 | 14.37±0.015 | |
| D4 | 40B | 20B | 2 | 16.10±0.024 | 13.85±0.016 |
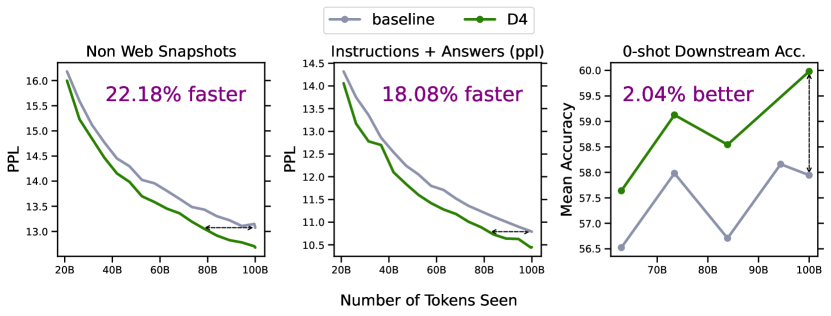
- D4 は 6.7B スケールで perplexity の約 18–20% の効率向上と下流の精度の平均約 2% の改善を示す。
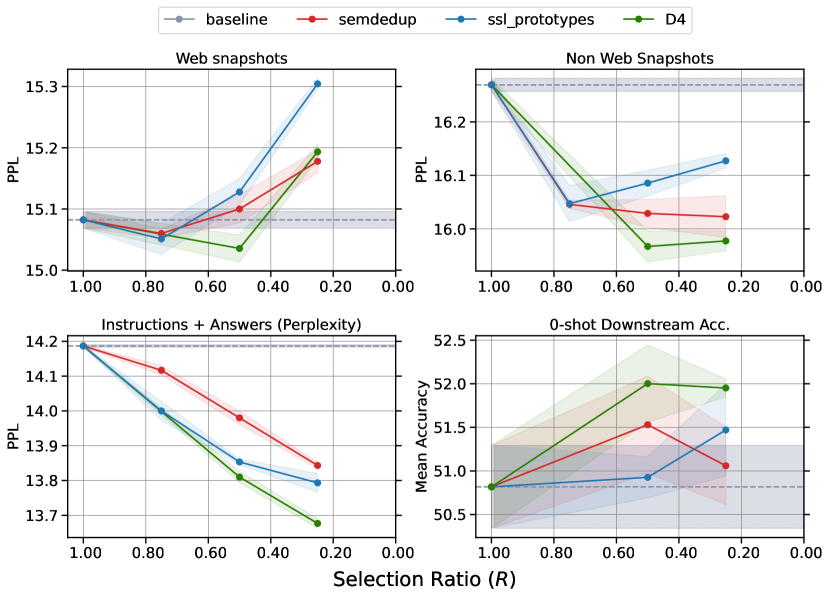
- D4 は tested settings 全体で SemDeDup または SSL Prototypes 単独より優れている。
- 固定データ制約下では、D4 による選択的データの繰り返し学習は新しいランダムデータトークンでの訓練を上回ることがある。
- 固定計算シナリオでは、より大きなデータを重複除去・多様化したサブセットを学習することで、同等の perplexity を 20% fewer の更新で達成できる。
- SemDeDup と SSL Prototypes の間で再クラスタリングは、重複に起因するクラスタを減らし性能を改善するために不可欠である。
- コスト分析は、モデル規模が大きくなるにつれて D4 の総合的な効率向上が増大することを示し、より大きなモデルでは ~20–22% 程度の利得が見込まれる。
より良い研究を、今すぐ始めましょう
論文設計から論文執筆まで、研究時間を劇的に削減しましょう。
クレジットカード登録不要
このレビューはAIが作成し、人間の編集者が確認しました。