
[論文レビュー] Enhanced Sub-kpc Scale Star-formation: Results From A JWST Size Analysis of 341 Galaxies At 5
本研究では、JWSTサイクル1のフィールドから341個の高赤方偏移銀河(5 < z < 14)を対象とし、深さのあるNIRCam画像と分光データを用いて解析した。その結果、赤方偏移に伴うサイズの緩やかな進化が示され、極めて高い星形成表面密度(>10 M☉ yr⁻¹ kpc⁻²)を示す、コンパクトでサブkpcスケールの星形成銀河が同定された。これは、AGNフィードバックの証拠がない中で、初期宇宙における強力な星形成活動を示唆している。
We present a comprehensive search and analysis of high-redshift galaxies in a suite of nine public JWST extragalactic fields taken in Cycle 1, covering a total effective search area of $\sim358{ m arcmin^2}$. Through conservative ($8σ$) photometric selection, we identify 341 galaxies at $51.5\,σ$ below the derived size-mass slope. These compact sources exhibit a high star formation surface density $Σ_{ m SFR}>10\,M_\odot\,{ m yr^{-1}\,kpc^{-2}}$, a range in which only $<0.01\,\%$ of the local star-forming galaxy sample is found. For those with available NIRSpec data, no evidence of ongoing supermassive black hole accretion is observed. A potential explanation for the observed high [OIII]-to-Hbeta ratios could be high shock velocities, likely originating within intense star-forming regions characterized by high $Σ_{ m SFR}$. Lastly, we find that the rest-frame UV and optical sizes of our sample are comparable. Our results are consistent with these early galaxies building up their structures inside-out and yet to exhibit the strong color gradient seen at lower redshift.
研究の動機と目的
- JWSTデータを用いて、高赤方偏移銀河(5 < z < 14)のレストフレームUVサイズ-星質量関係を特徴づけること。
- z > 5の宇宙時間における銀河サイズの進化、特にサイズ成長の割合を調査すること。
- 極めて高い星形成表面密度を示すコンパクトでサブkpcスケールの星形成銀河を同定・分析すること。
- 星形成およびフィードバック過程が、特にAGN活動が見られない状況下で、初期銀河構造に与える影響を評価すること。
- 低赤方偏移系のシステムに見られる典型的な色勾配や構造的特徴が、初期宇宙の銀河に見られるかどうかを検討すること。
提案手法
- 9つの公開済みのJWST銀河外フィールド(約358 arcmin²)において、341個の銀河を保守的な光度選別(8σ)で抽出した。
- NIRCamを用いたレストフレームUVおよび光学の光度測定を用い、サンプルの有効半径(Reff)と星質量(M*)を測定した。
- 回帰解析を適用し、Reff ∝ M*^0.19±0.03 のサイズ-質量関係と、サイズ-赤方偏移進化(Reff ∝ (1+z)^-0.4±0.2)を導出した。
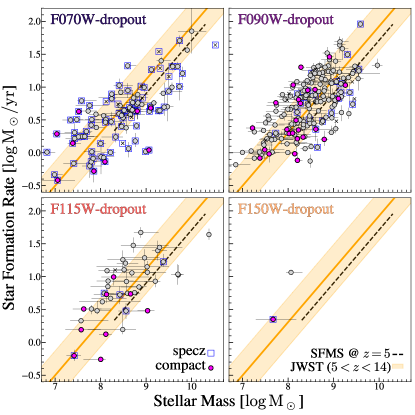
- 残差解析を用いてコンパクト源を同定し、サイズ-質量関係から1.5σ以上下回るものをフラグ付けた(サンプルの13%)。
- UVの等価光度と有効半径を用いて星形成表面密度(ΣSFR)を評価し、地上の銀河サンプルと比較した。
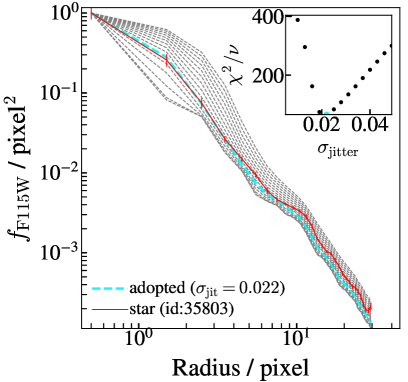
- 利用可能なNIRSpec分光データを分析し、AGNの兆候(例:高イオン化線)を探索し、[O iii]/Hβ比を用いて衝撃波または星形成爆発の起源を評価した。
実験結果
リサーチクエスチョン
- RQ15 < z < 14の銀河におけるレストフレームUVサイズ-星質量関係は、低赤方偏移銀河集団と比べてどのように異なるか?
- RQ2高赤方偏移銀河のサイズ進化の割合は、宇宙時間の経過とともにどのように変化するか?また、先行研究の推定値と比較するとどうなるか?
- RQ3高赤方偏移銀河のうち、コンパクト(サブkpcスケール)で極めて高い星形成表面密度を示す割合はどの程度か?
- RQ4最もコンパクトで高SFRの銀河に、活動的銀河核(AGN)活動の兆候は見られるか?
- RQ5一部のコンパクトで高SFRの銀河で観測された高い[O iii]/Hβ比を説明する物理的メカニズムは何か?
主な発見
- 高赤方偏移の星形成銀河におけるサイズ-星質量関係は、Reff ∝ M*^0.19±0.03 に従い、z ~ 3の星形成銀河と類似しているが、サイズは約0.7 dex小さくなっている。
- サイズ進化は以前の予想よりも遅く、Reff ∝ (1+z)^-0.4±0.2 に従う。これは、赤方偏移範囲5 < z < 14にわたってサイズの成長がほとんどないことを示唆している。
- サンプルの約13%が有効半径<100 pcのコンパクト源であり、サイズ-質量関係から1.5σ以上下回っている。
- これらのコンパクト銀河は極めて高い星形成表面密度(ΣSFR > 10 M☉ yr⁻¹ kpc⁻²)を示しており、これは地上の星形成銀河の0.01%未満の領域にしか見られない。
- 利用可能なNIRSpecデータから、コンパクト源に進行中の超大質量ブラックホール降着の証拠は得られなかった。
- 一部のコンパクト銀河で観測された高い[O iii]/Hβ比は、AGN活動ではなく、強力な星形成による高衝撃速度が原因である可能性がある。
より良い研究を、今すぐ始めましょう
論文の読解から最終レビューまで、研究時間を劇的に削減しましょう。
クレジットカード登録不要
このレビューはAIが作成し、人間の編集者が確認しました。