[論文レビュー] Environmental Burden of United States Data Centers in the Artificial Intelligence Era
過去1年間で米国のデータセンターは約105百万トンのCO2eを排出しました。炭素強度は国内平均の約48%上回り、電力の過半を化石燃料が供給しています。
The rapid proliferation of data centers in the US - driven partly by the adoption of artificial intelligence - has set off alarm bells about the industry's environmental impact. We compiled detailed information on 2,132 US data centers operating between September 2023 and August 2024 and determined their electricity consumption, electricity sources, and attributable CO$_{2}$e emissions. Our findings reveal that data centers accounted for more than 4% of total US electricity consumption - with 56% derived from fossil fuels - generating more than 105 million tons of CO$_{2}$e (2.18% of US emissions in 2023). Data centers' carbon intensity - the amount of CO$_{2}$e emitted per unit of electricity consumed - exceeded the US average by 48%. Our data pipeline and visualization tools can be used to assess current and future environmental impacts of data centers.
研究の動機と目的
- 2023年9月2024年8月に運用していた米国データセンターの電力消費量と米国の総消費電力に対する割合を定量化する。
- データセンターへ供給する発電所とバランシングオーソリティを特定し、これらの源への排出を帰属付けする。
- データセンターが使用する電力の燃料構成と炭素強度を特徴づけ、他セクター・他国と比較する。
- 政策と緩和策のためにデータセンターのエネルギー使用と排出を監視する再現性のあるデータパイプラインと公開ウェブプラットフォームを開発する。
- 規制措置や介入による炭素足跡の削減を目的として、地域/州レベルの粒度を提供する。
提案手法
- Baxtelデータ、ウェブスクレイピング、OpenStreetMap検証を用いて、2023年9月から2024年8月の間に運用される2,132の米国データセンターのデータセットを構築した。
- 欠損データセンター電力容量を勾配ブースト回帰木モデル(GBRT)で補完し、R2 = 0.77を達成した。
- 各データセンターをバランシングアーソリティに割り当て、排出量計算のためにEPA eGRIDデータを用いて供給発電所と結びつけた。
- 発電量加重寄与法を用いて各データセンターの電力需要を特定の発電所へ割り当て、CO2e排出量を算出した。
- CO2e/kWhとして炭素強度を計算し、米国の国内平均および国際的ベンチマークと比較した。
- データセンターのエネルギー負荷、排出、燃料構成をバランシングアソリティ、州、郡レベルで可視化する公開ウェブプラットフォームを開発した。

実験結果
リサーチクエスチョン
- RQ1研究期間中の米国データセンターの総電力消費量と、それが米国の電力使用全体に占める割合はどれくらいか?
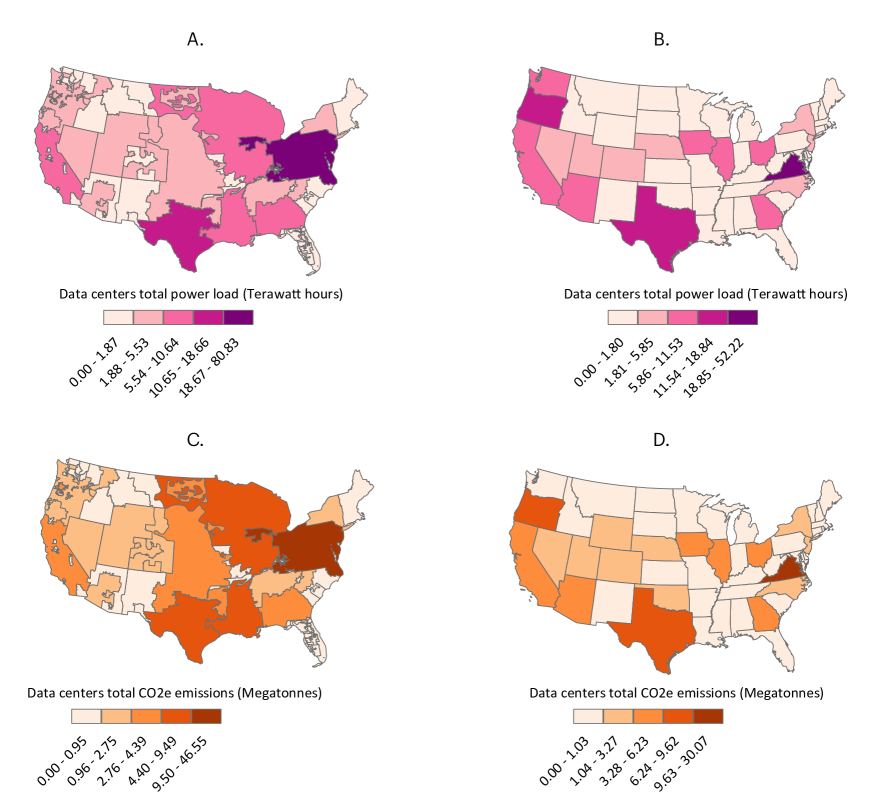
- RQ2データセンターに帰属されるCO2e排出量はどの程度で、これらの排出はバランシングアソリティ別・州別でどのように異なるか?
- RQ3データセンターが使用する電力の炭素強度はどの程度で、米国平均および国際値とどう比較されるか?
- RQ4データセンターの電力を動かす燃料構成はどうなっており、地域はデータセンターエネルギーの化石燃料(特に石炭)依存度が高いか?
- RQ5再現性のあるデータパイプラインと公開プラットフォームは、政策行動のための現在および将来のデータセンターの環境影響を正確に追跡できるか?
主な発見
- 研究期間中、データセンターは推定192.64 TWhを消費し、米国全体のエネルギー消費の約4.59%を占めた(2022年ベース)。
- データセンターに帰属される総CO2e排出量は1億5560万トン(105.59百万 metric tons)で、米国のエネルギー消費による排出の約2.18%、米国の総CO2e排出の約1.66%を占める。
- 化石燃料発電所はデータセンター電力の50%以上を供給しており、石炭は総エネルギーの16%、原子力は約21%、再生可能エネルギーは約22%であった。
- データセンターの加重平均炭素強度は548 g CO2e/kWhで、米国平均の369 g CO2e/kWhよりおおよそ48%高い。
- バージニア州、テキサス州、オレゴン州は米国内のデータセンター排出の主要な供給源であり、地域の排出プロファイルに大きなシェアを占めた。
- 著者らはバランシングアソリティ、州、郡別にデータセンターのエネルギー使用と排出を追跡する公開ウェブプラットフォームを提供する。
より良い研究を、今すぐ始めましょう
論文設計から論文執筆まで、研究時間を劇的に削減しましょう。
クレジットカード登録不要
このレビューはAIが作成し、人間の編集者が確認しました。