[論文レビュー] Explainable Data-driven Modeling of Adsorption Energy in Heterogeneous Catalysis
この論文は、OC20データを用いた吸着エネルギー予測を説明するために、浅いMLモデルと事後SHAP分析およびシンボリック回帰を組み合わせ、吸着種と触媒の特性を主要な推進力として特定し、解釈可能な関係を導出する。
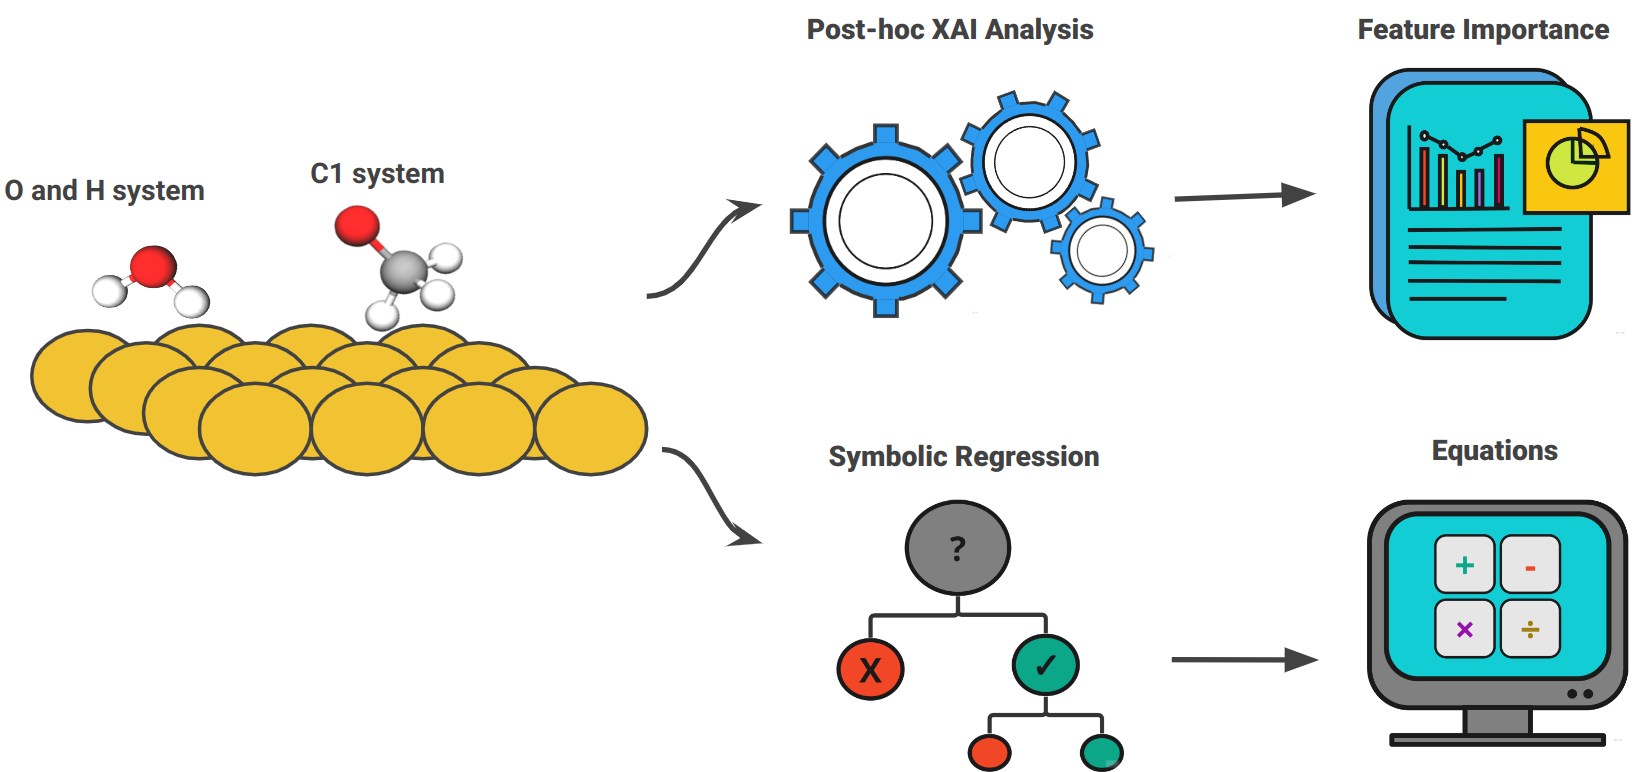
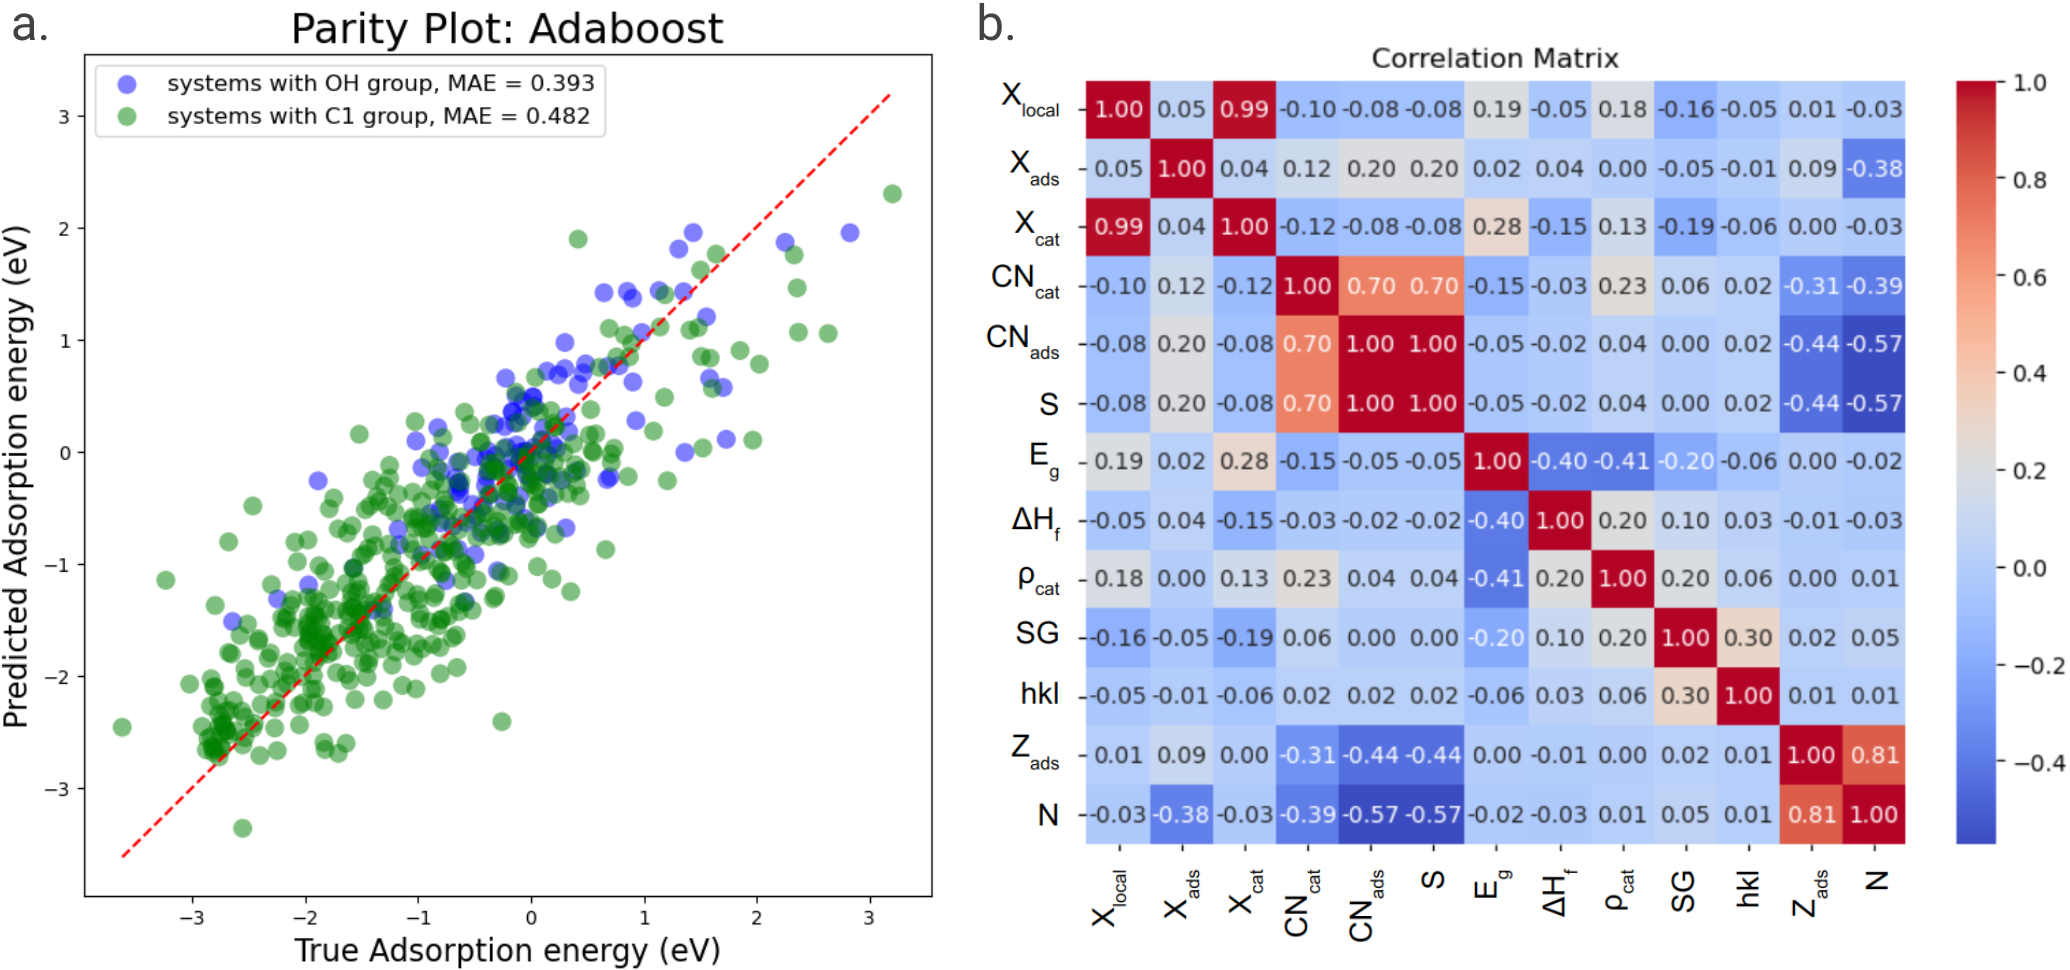
The increasing popularity of machine learning (ML) in catalysis has spurred interest in leveraging these techniques to enhance catalyst design. Our study aims to bridge the gap between physics-based studies and data-driven methodologies by integrating ML techniques with eXplainable AI (XAI). Specifically, we employ two XAI techniques: Post-hoc XAI analysis and Symbolic Regression. These techniques help us unravel the correlation between adsorption energy and the properties of the adsorbate-catalyst system. Leveraging a large dataset such as the Open Catalyst Dataset (OC20), we employ a combination of shallow ML techniques and XAI methodologies. Our investigation involves utilizing multiple shallow machine learning techniques to predict adsorption energy, followed by post-hoc analysis for feature importance, inter-feature correlations, and the influence of various feature values on the prediction of adsorption energy. The post-hoc analysis reveals that adsorbate properties exert a greater influence than catalyst properties in our dataset. The top five features based on higher Shapley values are adsorbate electronegativity, the number of adsorbate atoms, catalyst electronegativity, effective coordination number, and the sum of atomic numbers of the adsorbate molecule. There is a positive correlation between catalyst and adsorbate electronegativity with the prediction of adsorption energy. Additionally, symbolic regression yields results consistent with SHAP analysis. It deduces a mathematical relationship indicating that the square of the catalyst electronegativity is directly proportional to the adsorption energy. These consistent correlations resemble those derived from physics-based equations in previous research. Our work establishes a robust framework that integrates ML techniques with XAI, leveraging large datasets like OC20 to enhance catalyst design through model explainability.
研究の動機と目的
- データ駆動のMLと物理ベースの理解のギャップを吸着エネルギーモデリングで埋める。
- どの吸着種と触媒の特徴が吸着エネルギーに最も影響を与えるかを特定する。
- SHAP分析とシンボリック回帰を通じてML予測の解釈可能な説明を提供する。
- ポストホックの説明とシンボリック回帰結果の一貫性を示す。
- OC20を活用して、説明可能なモデルを通じた触媒設計に情報を提供する。
提案手法
- OC20由来の特徴量で浅いMLモデル(Adaboost、XGBoost、SVR、KRR、LASSO)を用いて吸着エネルギーを予測する。
- SHAPの事後分析を適用して特徴量の重要性と特徴間相関を決定する。
- PySRを用いたシンボリック回帰で、入力と吸着エネルギーの関係を解釈可能な方程式として導く。
- SHAPで得られた知見とシンボリック回帰方程式を比較して物理的妥当性を検証する。
- 事後分析にはサブセット2886系統、シンボリック回帰には水素吸着種サブセット994系統を使用する。
実験結果
リサーチクエスチョン
- RQ1OC20ベースのデータセットで吸着エネルギー予測に最も強く影響を与える特徴は何か。
- RQ2SHAP由来の説明はシンボリック回帰によって同定される物理的に動機づけられた関係と一致するか。
- RQ3触媒と吸着種の特徴の依存関係を単純な数式で表すことは可能か。
- RQ4吸着エネルギー予測における吸着種の特徴と触媒の特徴の比較はどうか。
主な発見
| モデル | MAE [eV] |
|---|---|
| Adaboost Regression | 0.446 ± 0.008 |
| XGBoost Regression | 0.461 ± 0.049 |
| Support Vector Regression | 0.477 ± 0.068 |
| Kernel Ridge Regression | 0.509 ± 0.089 |
| LASSO Regression | 0.617 ± 0.065 |
- SHAP重要度の上位5特徴: 吸着種の電気陰性度、吸着種原子数、触媒電気陰性度、実効配位数、吸着種原子番号の和。
- 吸着種の特性が触媒特性よりも吸着エネルギーに大きな影響を与える。
- このデータセットでは触媒電気陰性度と吸着エネルギーの正の相関が観察される。
- シンボリック回帰はSHAP結果と一致する関係を生み出し、特に ΔE_ads ∝ X_cat^2 のような式が複数の方程式に現れる。
- PySR由来のMAEは通常Trasattiの参照式より低く、より信頼性が高く単純な表現を示す。
- 触媒体の電気陰性度は吸着研究において表面電気陰性度の代理として機能し得る。
より良い研究を、今すぐ始めましょう
論文設計から論文執筆まで、研究時間を劇的に削減しましょう。
クレジットカード登録不要
このレビューはAIが作成し、人間の編集者が確認しました。