
[論文レビュー] Exploring the Growth Index $γ_L$: Insights from Different CMB Dataset Combinations and Approaches
本研究では、複数のCMBデータセットと2つのCAMB実装(MGCAMBおよびCAMB_GammaPrime_Growth)を用いて成長指数 $\gamma_L$ を調査した。プランクデータのみを用いた場合、$\gamma_L$ の値は $\Lambda$CDMの予測値0.55からずれるが、2つのコード間で逆方向にずれる。一方、CMBライティングデータを追加すると、$\gamma_L$ は0.55に一致し、プランクの $A_{\rm lens}$ 問題が乖離の原因であると示唆された。
In this study we investigate the growth index $γ_L$, which characterizes the growth of linear matter perturbations, while analysing different cosmological datasets. We compare the approaches implemented by two different patches of the cosmological solver CAMB: MGCAMB and CAMB_GammaPrime_Growth. In our analysis we uncover a deviation of the growth index from its expected $Λ$CDM value of $0.55$ when utilizing the Planck dataset, both in the MGCAMB case and in the CAMB_GammaPrime_Growth case, but in opposite directions. This deviation is accompanied by a change in the direction of correlations with derived cosmological parameters. However, the incorporation of CMB lensing data helps reconcile $γ_L$ with its $Λ$CDM value in both cases. Conversely, the alternative ground-based telescopes ACT and SPT consistently yield growth index values in agreement with $γ_L=0.55$. We conclude that the presence of the A$_{\mathrm{lens}}$ problem in the Planck dataset contributes to the observed deviations, underscoring the importance of additional datasets in resolving these discrepancies.
研究の動機と目的
- 多様なCMBデータセットの組み合わせを用いて、$\Lambda$CDMの整合性を $\gamma_L$ を用いて探る。
- MGCAMBおよびCAMB_GammaPrime_Growthの2つのCAMB実装における $\gamma_L$ の挙動を比較する。
- プランクデータからの $\gamma_L$ のずれが、システムティックな誤差に起因するかどうかを評価する。
- CMBライティングおよび追加のデータセット(ACT、SPT、BAO)が $\gamma_L$ の矛盾をどのように解消するかを評価する。
- 観測された $\gamma_L$ のずれが、$H_0$ および $S_8$ の既知の宇宙論的矛盾と相関しているかどうかを特定する。
提案手法
- CAMB宇宙論的コードのMGCAMBおよびCAMB_GammaPrime_Growth実装を用いて、異なるデータセットの組み合わせ下での $\gamma_L$ を計算した。
- プランク、ACT、SPT、CMBライティング、BAO、WMAPのデータセットをさまざまな組み合わせで分析し、結果の頑健性を評価した。
- 現象論的成長率パラメータライゼーション $G(a) = f(a, \gamma_L, \Omega_{m,0})$ を適用し、$\Lambda$CDMでは $\gamma_L \approx 0.55$ となるようにした。
- ベイズ的パrameter推定を用いて $\gamma_L$ を制約し、$H_0$、$S_8$、$\Omega_{m,0}$ との相関関係を評価した。
- ライティングや代替CMB実験の影響を特定するために、さまざまなデータ組み合わせの結果を比較した。
- 0.55からのずれの有意性を評価し、プランクデータの $A_{\rm lens}$ 問題が果たす役割を検証した。
実験結果
リサーチクエスチョン
- RQ1プランクCMBデータを単独で分析した場合、成長指数 $\gamma_L$ は $\Lambda$CDMの予測値0.55からずれるか?
- RQ2MGCAMBおよびCAMB_GammaPrime_Growthの2つのCAMB実装は、プランクデータからの $\gamma_L$ 評価でどのように異なるか?
- RQ3CMBライティングデータを含めることで、$\gamma_L$ は $\Lambda$CDMの0.55にどの程度回復するか?
- RQ4ACTやSPTなどの独立したCMB実験は、0.55と整合する $\gamma_L$ 値をもたらすか?プランクとの比較は?
- RQ5先行研究が示唆するように、プランクデータにおける観測された $\gamma_L$ のずれは、$A_{\rm lens}$ 問題に起因するか?
主な発見
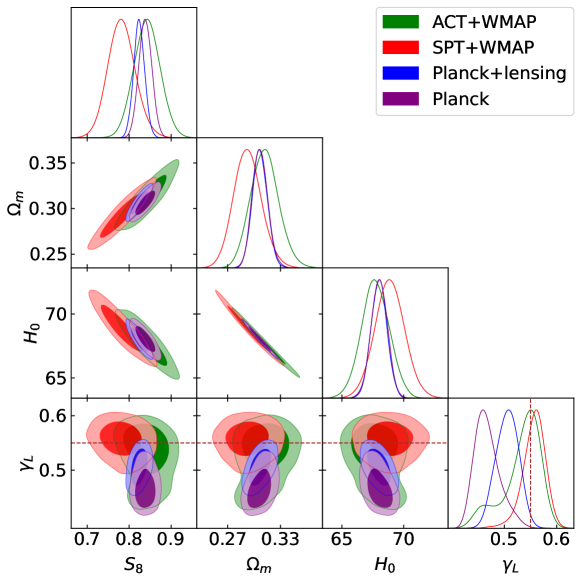
- MGCAMBフレームワーク下で、プランクデータのみを用いた場合、$\gamma_L = 0.506 \pm 0.046$ が得られ、$\Lambda$CDMの0.55から3$\sigma$以上ずれていた。
- CAMB_GammaPrime_Growthフレームワーク下では、プランクデータから $\gamma_L = 0.669 \pm 0.069$ が得られ、MGCAMBとは逆方向に0.55からずれていた。
- CMBライティングデータを追加すると、MGCAMBおよびCAMB_GammaPrime_Growthの両ケースで $\gamma_L$ のずれが減少し、$\Lambda$CDMの値から $1.7\sigma$ 以内に収束した。
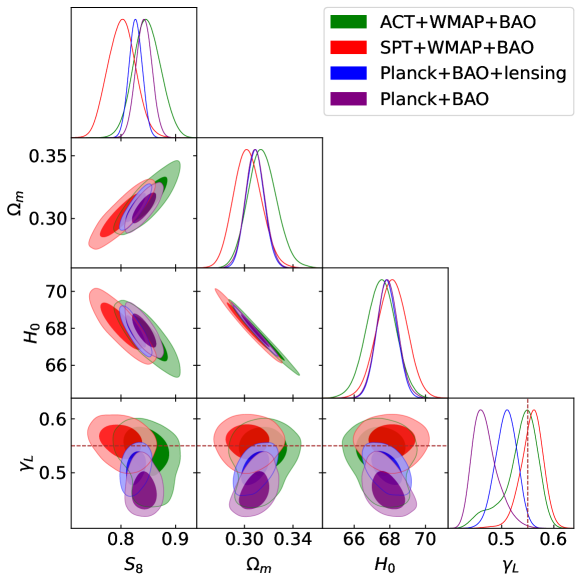
- ACTおよびSPTデータセットは、すべてのテストされた組み合わせで $\gamma_L$ 値を0.55の $1\sigma$ 以内に保ち、BAOデータを追加しても顕著なシフトは認められなかった。
- 2つのCAMB実装間で、$\gamma_L$、$H_0$、$S_8$ 間の相関構造の符号が逆転しており、コード固有の実装に依存する感度が示された。
- プランクデータにおける観測された $\gamma_L$ のずれは、$A_{\rm lens}$ 問題に起因すると特定され、CMBライティングデータが乖離を解消する鍵的診断手段となった。
より良い研究を、今すぐ始めましょう
論文の読解から最終レビューまで、研究時間を劇的に削減しましょう。
クレジットカード登録不要
このレビューはAIが作成し、人間の編集者が確認しました。