[論文レビュー] Exploring the nature of UV-bright $z \gtrsim 10$ galaxies detected by JWST: star formation, black hole accretion, or a non-universal IMF?
研究はCosmic Archaeology Tool(CAT)半解析モデルを用いてPop III/II星とAGNのUV光度関数における役割をz~4から20まで定量化し、JWSTデータと比較し、z>10での緊張を解消する解としてIMF進化を検証します。
We use the Cosmic Archaeology Tool (CAT) semi-analytical model to explore the contribution of Population (Pop) III/II stars and active galactic nuclei (AGNs) to the galaxy UV luminosity function (LF) evolution at $4 \leq z \leq 20$. We compare in particular with recent JWST data in order to explore the apparent tension between observations and theoretical models in the number density of bright galaxies at $z \gtrsim 10$. The model predicts a star formation history dominated by UV faint ($M_{ m UV} > - 18$) galaxies, with a Pop III contribution of $\lesssim 10\%$ ($\lesssim 0.5\%$) at $z \simeq 20$ ($z \simeq 10$). Stars are the primary sources of cosmic reionization, with $5 - 10 \%$ of ionizing photons escaping into the intergalatic medium at $5 \leq z \leq 10$, while the contribution of unobscured AGNs becomes dominant only at $z \lesssim 5$. The predicted stellar and AGN UV LFs reproduce the observational data at $5 \lesssim z \lesssim 9 - 10$. At higher redshift, CAT predicts a steeper evolution in the faint-end slope ($M_{ m UV} > - 18$), and a number density of bright galaxies ($M_{ m UV} \simeq -20$) consistent with data at $z \sim 10 - 11$, but smaller by 0.8 dex at $z \sim 12 - 13$, and 1.2 dex at $z \sim 14 - 16$, when compared to the values estimated by recent studies. Including the AGN emission does not affect the above findings, as AGNs contribute at most to $\lesssim 10 \%$ of the total UV luminosity at $M_{ m UV} < - 19$ and $z \gtrsim 10$. Interestingly, considering a gradual transition in the stellar IMF, modulated by metallicity and redshift as suggested by recent simulations, the model agrees with JWST data at $z \sim 12 - 13$, and the disagreement at $z \sim 14 - 16$ is reduced to 0.5 dex.
研究の動機と目的
- z~4〜20のUVLF進化におけるPop III/II星とAGNの寄与を評価する。
- z>10で明るい端のUV輻射に対するAGN発光の影響を評価する。
- 金属量と赤shiftsによる段階的 IMF 過渡がUVLF予測へ与える影響を検証する。
- CATの予測をJWST観測と比較し、緊張と解決の可能性を特定する。
提案手法
- CATを用いてz=4からz=24までのDM合体 historiesの大規模サンプルを生成する。
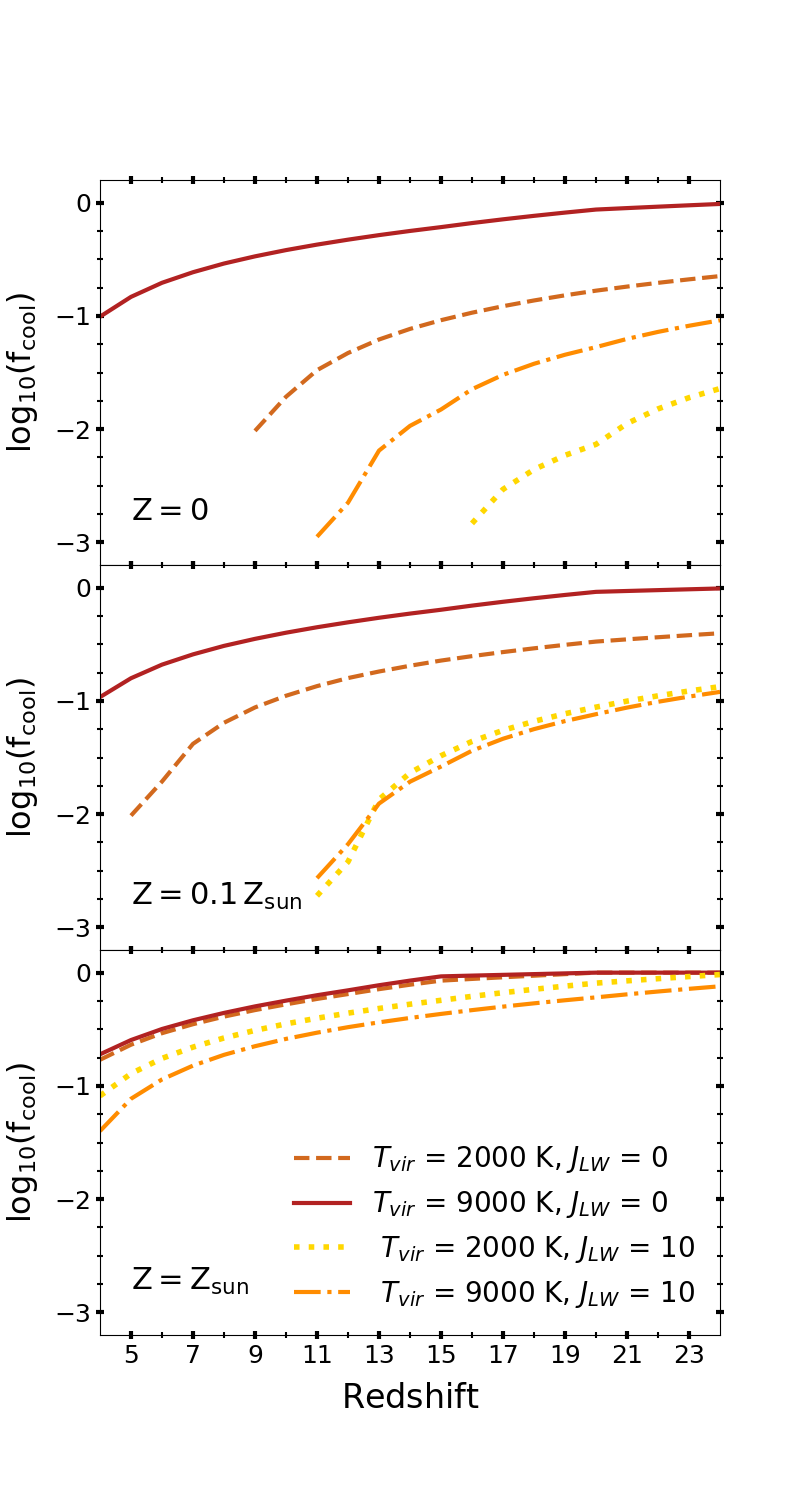
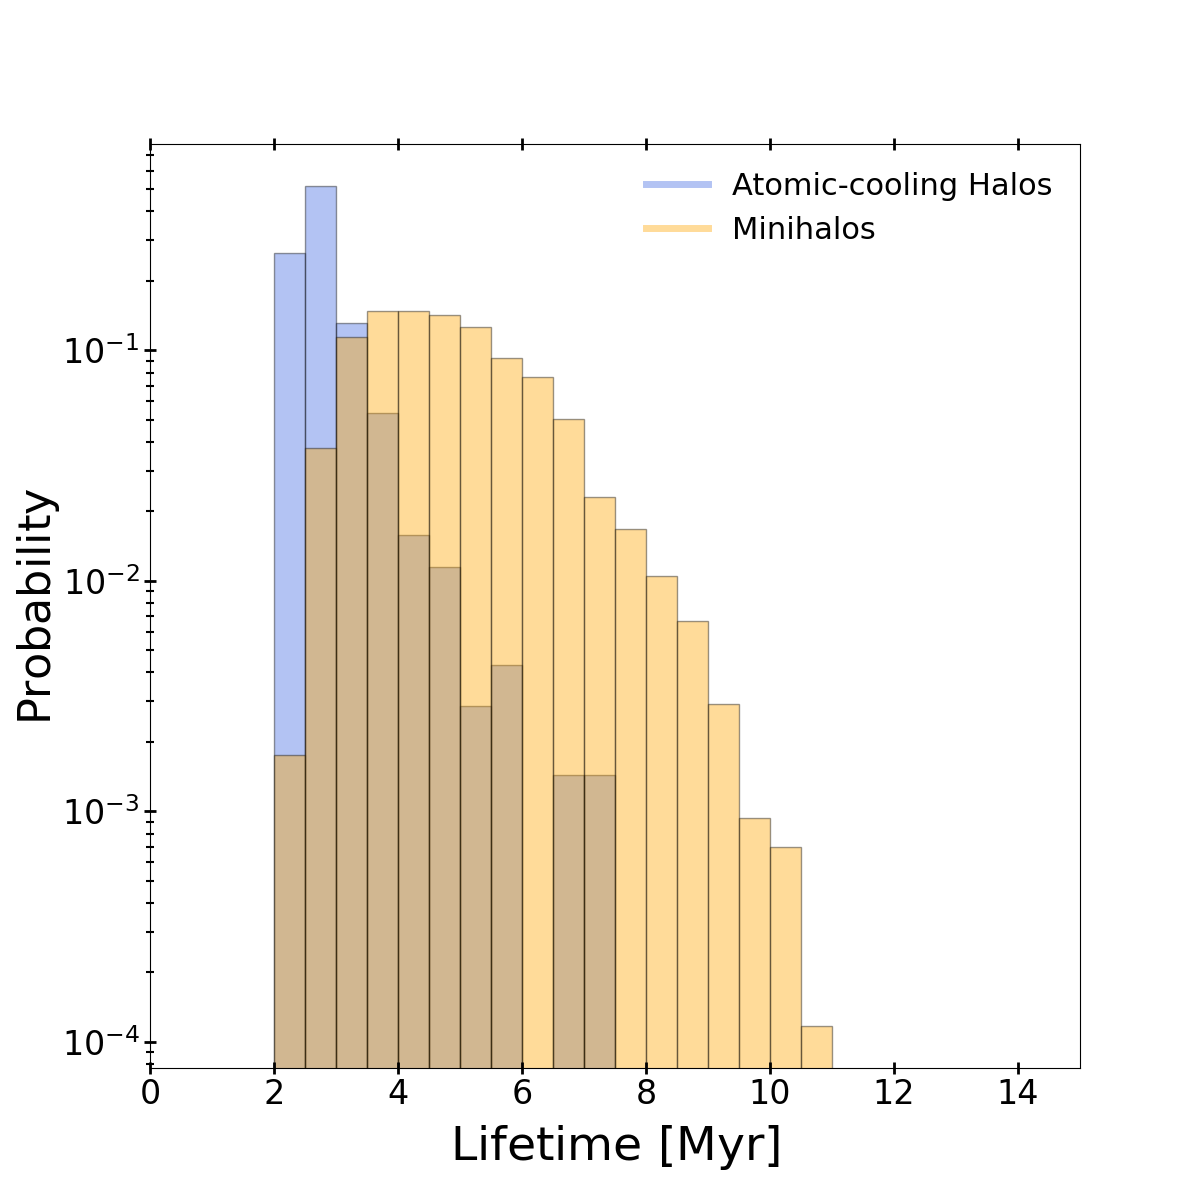
- calibrated SFR処方を用いてミニハロと原子冷却ハロの星形成をモデル化する。
- Zcritを伴うPop III IMFの確率的サンプリングとPop IIへの遷移、さらにPop IIIのSF効率の強化を実装する。
- BH種形成、Eddington上限を考慮したBondi-Hoyle accretionによる成長、合併を計算する。
- SNおよびAGNの機械的フィードバックとLW/UV放射フィードバックを含め、冷却と星形成に影響を与える。
- Pop II/III星と初期BHsからのフォト電離放射をモデル化し、赤shifts依存の逃げ率とIGMのクランブを用いて再電離(Q_HII)とtau_eを追跡する。
実験結果
リサーチクエスチョン
- RQ14 ≤ z ≤ 20にわたるUV光度函数へのPop III/II星とAGNの相対寄与はどれくらいか。
- RQ2AGN放出を含めることでz ≳ 10で理論予測と観測UV LFを整合させることができるか。
- RQ3金属量/赤shiftsによる段階的 IMF 遷移はz ≈ 12–16のJWSTデータとの一致を改善するか。
- RQ4UV LFの faint and brightエンドのモデル予測とJWST測定を比較し、どこに緊張が残るか。
主な発見
- UV輻射へのPop IIIの寄与は小さく、z ≈ 20で≲10%、z ≈ 10で≲0.5%程度。
- 星は宇宙再電離の主要な源であり、z=5からz=10の間にIGMへ5–10%の電離光子が逃げる。
- 未塗潤のAGNはz ≳ 10でM_UV < −19に対して全UV輻射の最大≲10%を占める。
- 星とAGNからの予測UV LFは5 ≲ z ≲ 9–10のデータと一致するが、それ以降はfaint-endの進化が急で、z~10–11付近の明るい端密度はデータと一致するが、z~12–13で約0.8 dex、z~14–16で約1.2 dex低い。いくつかの研究と比較して。
- AGN放出を含めても高赤方偏移領域のLFに関する結論は大きく変わらない。
- 金属量/赤shiftsによる段階的 IMF 遷移はJWSTデータとz~12–13で一致させ、z~14–16の不一致を約0.5 dexへ低減する。
より良い研究を、今すぐ始めましょう
論文設計から論文執筆まで、研究時間を劇的に削減しましょう。
クレジットカード登録不要
このレビューはAIが作成し、人間の編集者が確認しました。