
[論文レビュー] Fascinating Supervisory Signals and Where to Find Them: Deep Anomaly Detection with Scale Learning
本稿では、テーブルデータにおける自己教師あり異常検出のための新規手法SLADを提案する。この手法は、部分ベクトルの次元数と表現サイズの関係として定義される「スケール」を、データ駆動型の教師信号として導入する。異なる部分空間における表現の順序付けを分布整合性を用いて学習させることで、高次のデータの規則性を捉え、多様なテーブルベンチマークで最先端の性能を達成し、従来の生成的・対照的手法と比較してAUC-ROCが顕著に向上する。
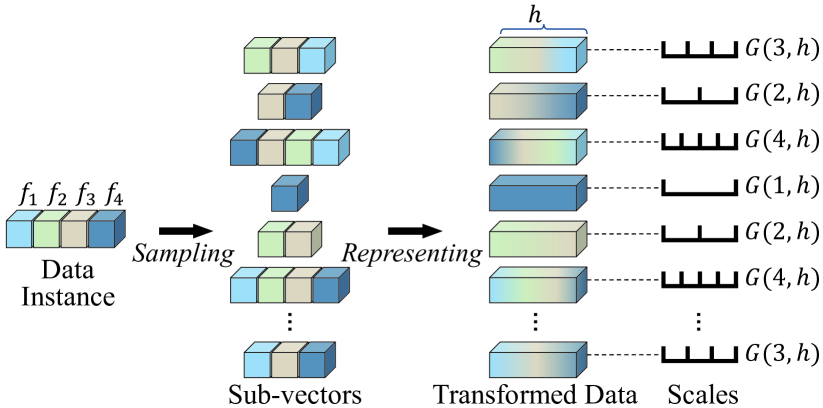
Due to the unsupervised nature of anomaly detection, the key to fueling deep models is finding supervisory signals. Different from current reconstruction-guided generative models and transformation-based contrastive models, we devise novel data-driven supervision for tabular data by introducing a characteristic -- scale -- as data labels. By representing varied sub-vectors of data instances, we define scale as the relationship between the dimensionality of original sub-vectors and that of representations. Scales serve as labels attached to transformed representations, thus offering ample labeled data for neural network training. This paper further proposes a scale learning-based anomaly detection method. Supervised by the learning objective of scale distribution alignment, our approach learns the ranking of representations converted from varied subspaces of each data instance. Through this proxy task, our approach models inherent regularities and patterns within data, which well describes data "normality". Abnormal degrees of testing instances are obtained by measuring whether they fit these learned patterns. Extensive experiments show that our approach leads to significant improvement over state-of-the-art generative/contrastive anomaly detection methods.
研究の動機と目的
- 従来の再構成や対照的手法が適用しにくいテーブルデータにおける深層異常検出のための有効な教師信号の設計という課題に取り組む。
- 低次の再構成誤差ではなく、高次の構造的パターンを捉える新たなデータ駆動型の教師信号を考案する。
- データ表現の学習可能な内在的特徴として「スケール」を導入することで、テーブルデータにおける自己教師学習を可能にする。
- 部分空間間での表現の相対的順序をモデル化することにより、正常性を学習し、推論時に学習済みパターンからの逸脱度を異常スコアとして算出する。
提案手法
- 部分ベクトルの次元数とその表現サイズの数学的関係として、テーブルデータにおける「スケール」の概念を導入する。
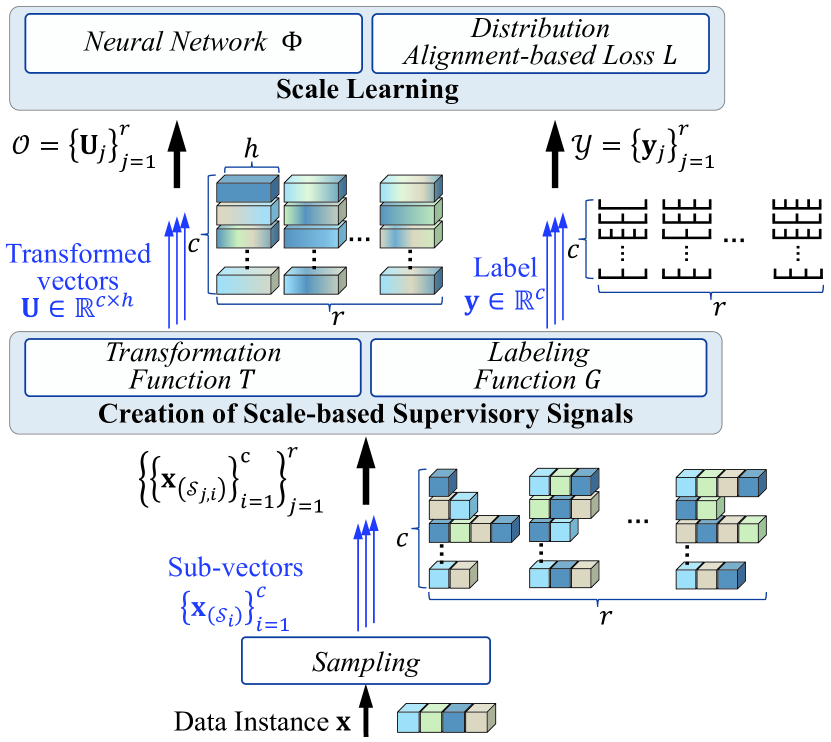
- 各データインスタンスのランダムな部分ベクトルを表現に変換し、それらに対応するスケール値でラベル付けすることで、教師信号を生成する。
- スケール学習を、絶対値ではなく相対順序に注目する分布整合性タスクとして定式化し、表現の順序付けを学習する。
- 予測されたスケール分布と真のスケール分布との間の分布的乖離に基づく損失関数を用いて、各インスタンスの部分ベクトル間での整合性を最適化する。
- ランダムアフィン変換やMLPなどの学習可能な変換関数を用いて、部分ベクトルから多様な表現を生成し、情報量の多い特徴を強調するための特徴重みを導入する。
- スケール学習を代理タスクとして用い、データの規則性を学習し、推論時にその学習済みパターンからの逸脱度を測ることで異常スコアを算出する。
実験結果
リサーチクエスチョン
- RQ1部分ベクトルの次元数と表現サイズの関係として定義されるスケールは、テーブルデータにおける自己教師あり異常検出のための有効な教師信号として機能するか?
- RQ2スケール学習を分布整合性タスクとして定式化することで、点ごとの再構成や分類ベースの手法と比較して、データの規則性のモデル化がどのように向上するか?
- RQ3提案手法は、多様なテーブルベンチマークにおいて、最先端の生成的・対照的異常検出モデルを上回る性能を発揮するか?
- RQ4表現学習の過程でノイズ混在や不要な部分ベクトルが存在する場合、この手法はどの程度頑健か?
主な発見
- SLADは10種類の多様なテーブルデータセットで最先端の性能を達成し、従来の生成的・対照的手法を顕著に上回る。
- 甲状腺疾患データセットではAUC-ROCが0.995を達成し、特徴重みなしのアブレーションと比較して4.7%の向上を示した。
- 平均二乗誤差損失(w/ L_mse)を用いる方が交差エントロピー損失(w/ L_ce)よりも性能が優れており、定量化されたスケールラベルが定性的な分類よりも効果的であることが示唆された。
- 分布整合性に基づくスケール学習アプローチは、分類や対照学習といった代表的な代理タスクを上回り、Waveformでは54.1%、Thrombinでは90.9%の性能向上を示した(交差エントロピーのアブレーションと比較)。
- ランダムアフィン変換(w/ T_Zero)を用いたSLADは、多数のデータセットでMLPベースの変換よりも優れた性能を示しており、シンプルでデータ拡張効果のある変換の有効性が裏付けられた。
- Thrombinのような超高次元データでは、w/ T_Zeroが計算制約により失敗するが、SLADは低次元特徴重みにより強力な性能を維持した。
より良い研究を、今すぐ始めましょう
論文の読解から最終レビューまで、研究時間を劇的に削減しましょう。
クレジットカード登録不要
このレビューはAIが作成し、人間の編集者が確認しました。