
[論文レビュー] Graph Representation of the Magnetic Field Topology in High-Fidelity Plasma Simulations for Machine Learning Applications
本論文は、Vlasiatorがシミュレートする地球の磁気圏尾部の高精度なプラズマシミュレーションにおける3次元磁場ベクトル場の位相的データ解析のスケーラブルなパイプラインを提案している。空間的および時空間的ノードグラフを用いて磁場位相を表現し、複雑な磁場再接続ダイナミクスを構造化されたグラフ入力に変換することで、機械学習応用(特にグラフニューラルネットワーク)を可能にした。実装結果は、Vlasiatorシミュレーションで得られたものである。
Topological analysis of the magnetic field in simulated plasmas allows the study of various physical phenomena in a wide range of settings. One such application is magnetic reconnection, a phenomenon related to the dynamics of the magnetic field topology, which is difficult to detect and characterize in three dimensions. We propose a scalable pipeline for topological data analysis and spatiotemporal graph representation of three-dimensional magnetic vector fields. We demonstrate our methods on simulations of the Earth's magnetosphere produced by Vlasiator, a supercomputer-scale Vlasov theory-based simulation for near-Earth space. The purpose of this work is to challenge the machine learning community to explore graph-based machine learning approaches to address a largely open scientific problem with wide-ranging potential impact.
研究の動機と目的
- 3次元磁場再接続という、複雑かつ未解明な現象を検出・特徴付ける挑戦に応えること。
- 高精度な3次元磁場ベクトル場から、特に磁場ノードを抽出するためのスケーラブルで自動化されたパイプラインを開発すること。
- 磁場位相を空間的および時空間的グラフ表現に変換することで、グラフニューラルネットワークへの入力として利用可能な構造化された入力を提供し、機械学習応用を可能にすること。
- データ駆動型で解釈可能なフレームワークを提供し、地球の磁気圏およびその他の領域における磁場再接続およびプラズモイド形成の研究を支援すること。
- 機械学習コミュニティに、広範な宇宙天気への影響を及ぼす可能性のあるプラズマ物理学における未解決問題を、グラフベースの手法で解決するよう挑戦すること。
提案手法
- 本手法は、Vlasiatorシミュレーションの3次元ベクトル場から磁場ノードを検出し分類するために拡張されたベクトル場位相フィルタを備えたVisualization Toolkit (VTK) を使用する。
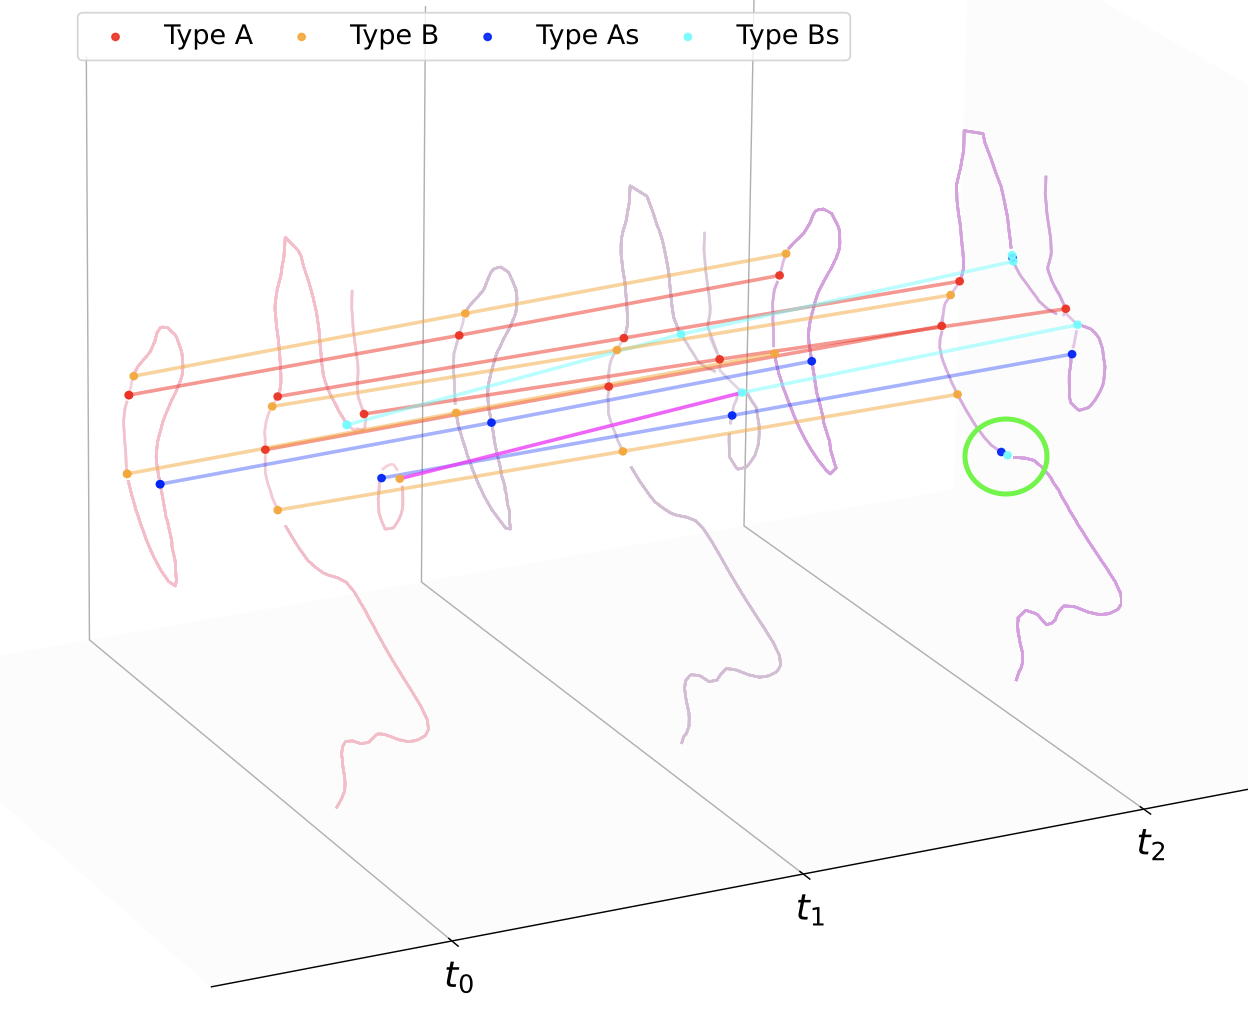
- 空間的ノードグラフは、磁場ノードをノードとして、それらの位相的接続(例:分離子、分離曲線)をエッジとして表現し、エッジの色で接続タイプを符号化する。
- 時空間的ノードグラフは、連続する時間ステップ間で同じノードの時間的変化を追跡することで構築され、時間的エッジが連続する時間ステップ間の同一ノードを結ぶ。
- 磁場のヤコビアン行列の固有値に基づいてノードタイプを分類し、4つの明確に区別できる位相的タイプが同定された。
- パイプラインは、全ベクトル場データではなく、位相的特徴に限定することで、大規模データ(例:約2億9300万グリッド点)を処理し、次元削減を実現しながら物理的意味を保持する。
- 得られたグラフは、グラフニューラルネットワークの入力として設計されており、磁場再接続検出およびプラズモイド予測の両方の時間的・空間的学習タスクをサポートする。

実験結果
リサーチクエスチョン
- RQ1高精度なプラズマシミュレーションにおける3次元磁場ベクトル場の位相的位相を、機械学習に適した方法で体系的に表現するにはどうすればよいか?
- RQ23次元における磁場再接続を特徴付ける主な位相的特徴とは何か。特に、磁場ノードおよびその接続は何か?
- RQ3磁場ノードの時間的変化をどのようにモデル化すれば、動的な再接続プロセスを捉えることができるか?
- RQ4磁場ノードの時空間的グラフ表現は、磁気圏尾部におけるプラズモイド形成の検出および予測を改善できるか?
- RQ5このような位相的グラフに基づくグラフベースの機械学習モデルは、従来の手法に比べて、再接続サイトの同定においてどの程度優れているか?
主な発見
- パイプラインは、Vlasiatorがシミュレートする地球の磁気圏尾部の3次元磁場ベクトル場から、2次元および適切な磁場ノードを正常に検出し分類した。
- 空間的ノードグラフはノードとしてノード、エッジとして位相的接続を表現し、異なる色で空間的接続タイプを符号化した。
- 時空間的ノードグラフは1秒間隔の時間ステップでノードの時間的変化を追跡し、ノードの分岐やタイプ変化といった動的プロセスを明らかにした。
- 分岐イベントの後に、互いに反対極性を持つノードのペアが形成された。この現象は、時空間的グラフ上で緑色の円でマークされ、再接続の前兆である可能性を示唆した。
- 本手法は大規模データにスケーラブルであり、全グリッド点数が約2億9300万のシミュレーションを、ベクトル場全体ではなく位相的特徴に焦点を当てることで処理可能であった。
- 得られたグラフは構造的で解釈可能な入力として、グラフニューラルネットワークに適しており、複雑なプラズマ環境における磁場再接続およびプラズモイド形成の検出に新たな手法を提供した。
より良い研究を、今すぐ始めましょう
論文の読解から最終レビューまで、研究時間を劇的に削減しましょう。
クレジットカード登録不要
このレビューはAIが作成し、人間の編集者が確認しました。