
[論文レビュー] HERA bound on x-ray luminosity when accounting for population III stars
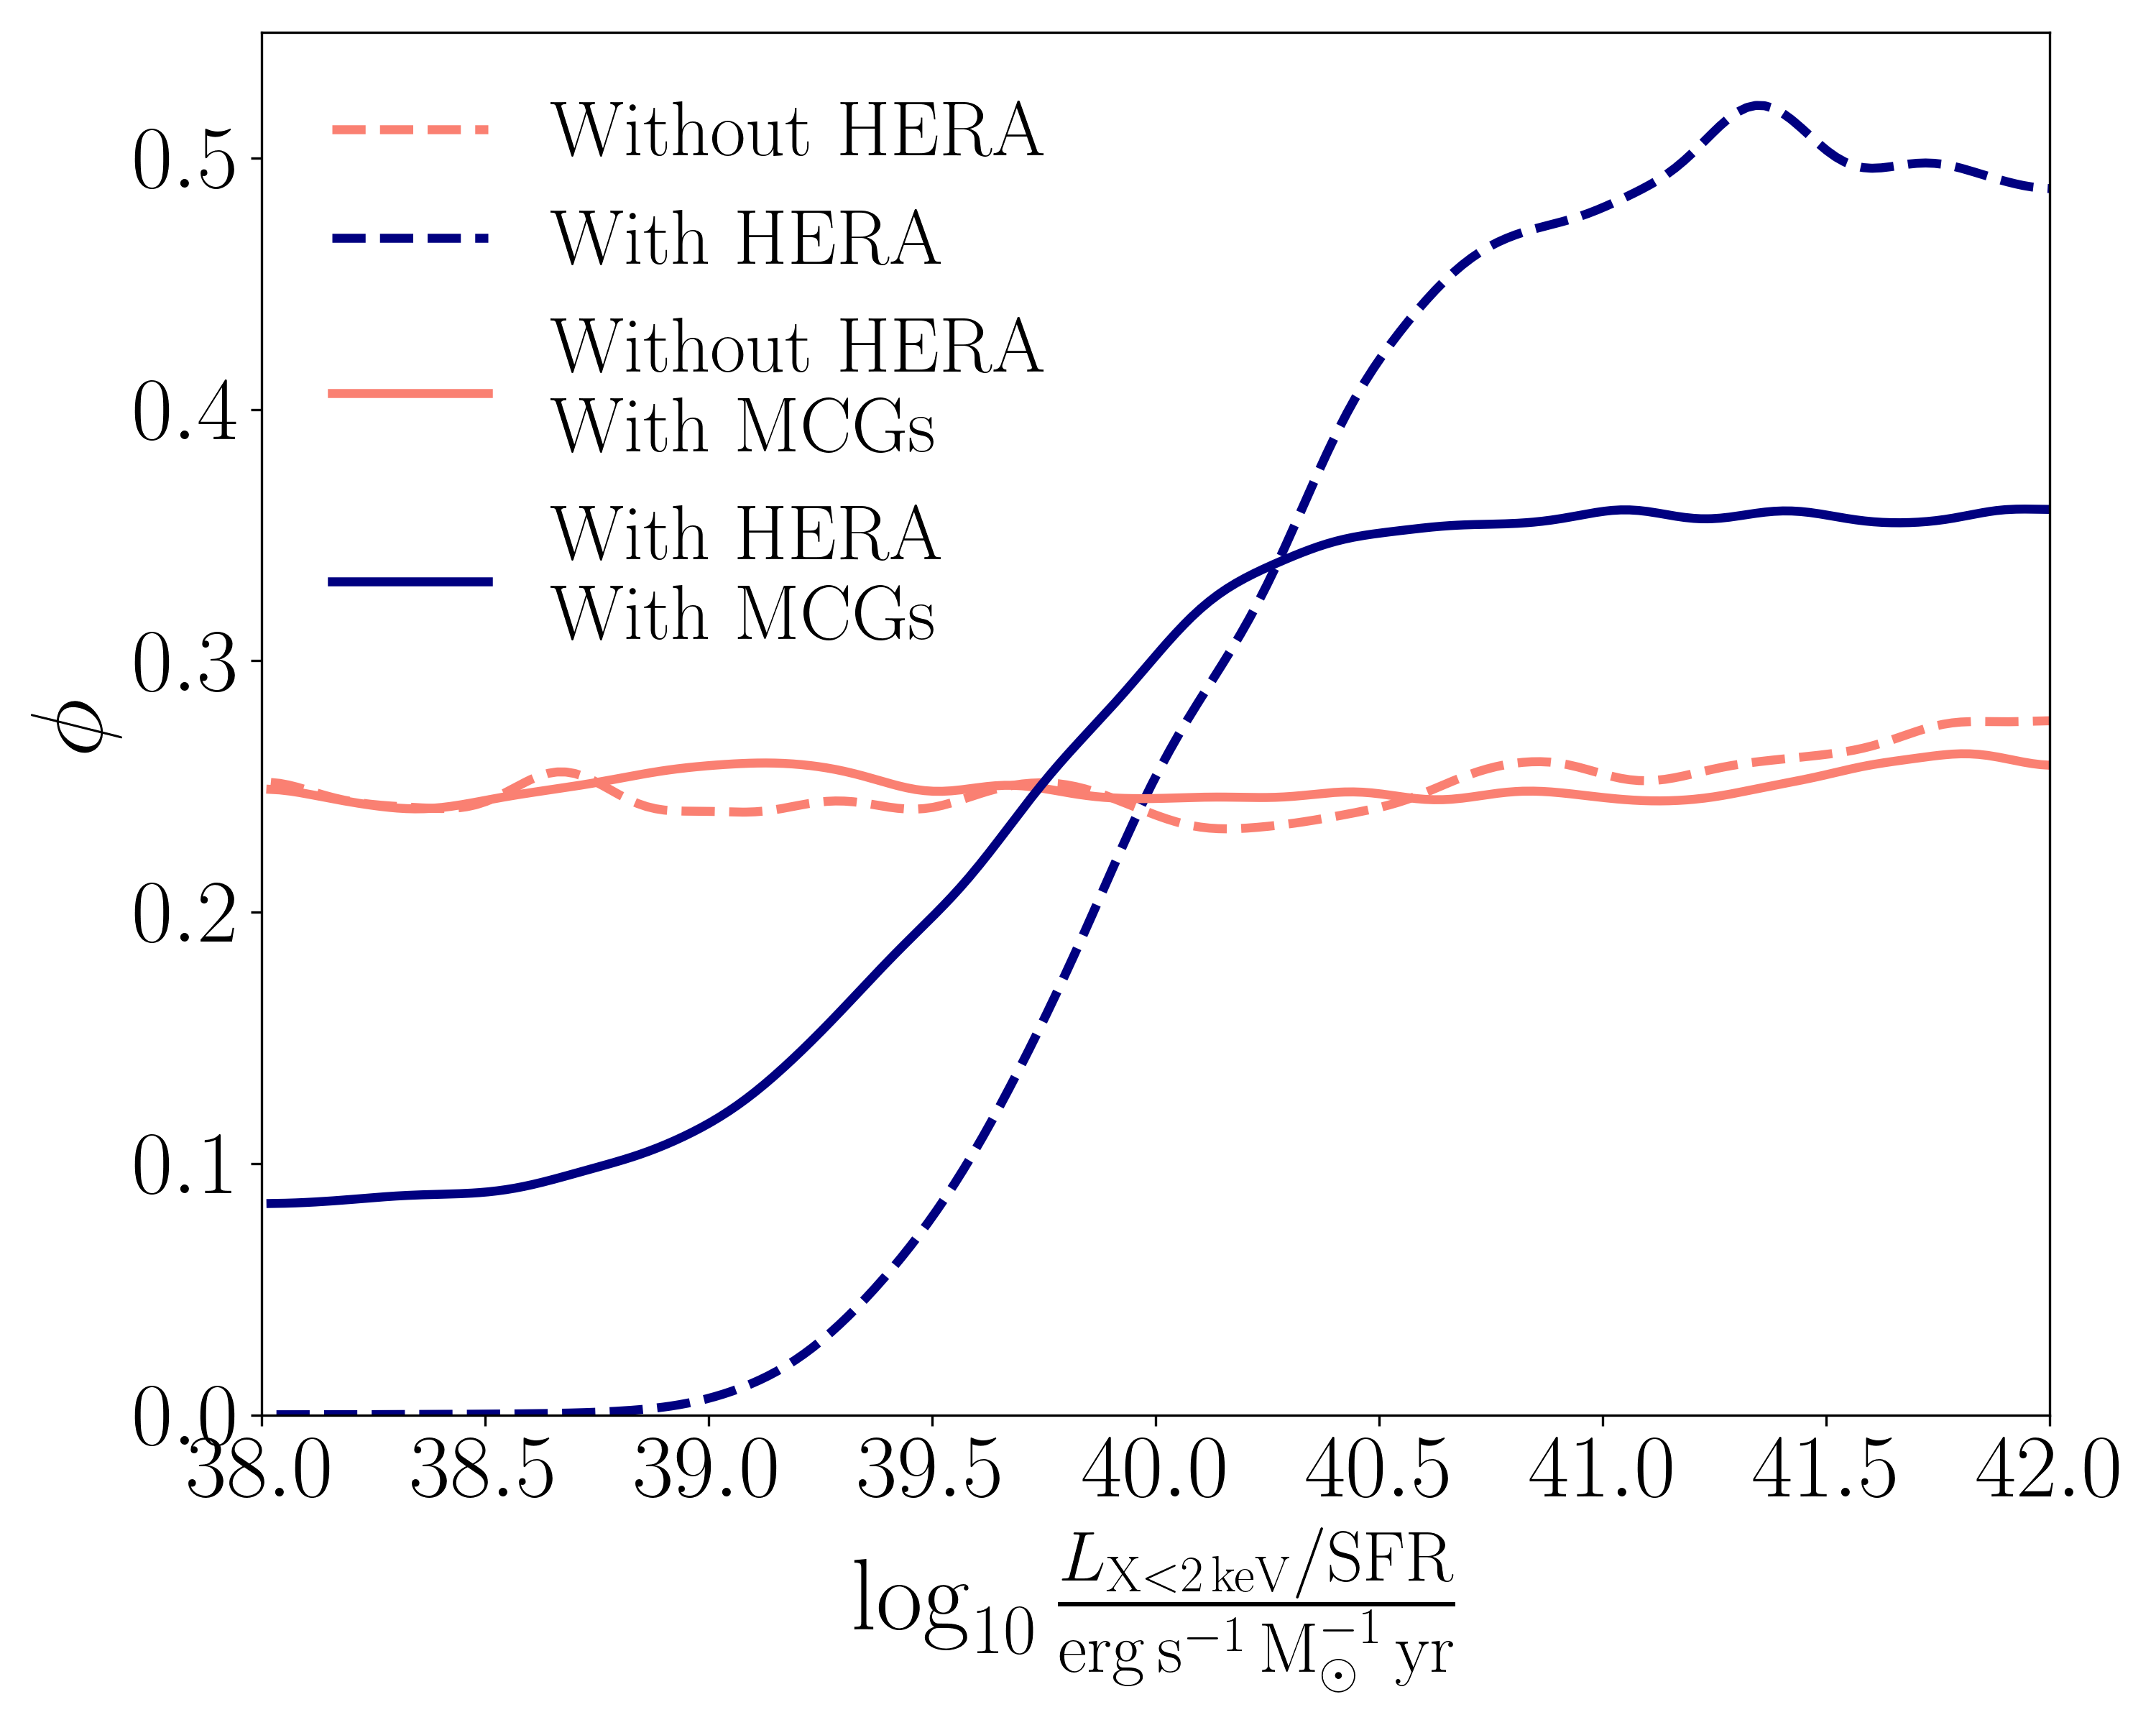
この論文は、21-cm信号シミュレーションに恒星形成率(SFR)単位あたりのソフトバンドX線輝度(L_X<2keV/SFR)に関するHERAの制約を再検討し、第III族星を宿す分子冷却銀河(MCGs)を組み込むことで、高いX線輝度の必要性が低下し、以前は強く排除されていたL_X<2keV/SFR ≲ 10^39.5 erg s⁻¹ M☉⁻¹ yr⁻¹ の値が、現在の局所X線源と整合的になることを示している。機械学習エミュレータとMCMC推論を用いて、MCGsの導入により、X線輝度の高い源を必要としなくてもよいことが明らかになった。
Recent upper bounds from the Hydrogen Epoch of Reionization Array (HERA) on the cosmological 21-cm power spectrum at redshifts $z \approx 8, 10$, have been used to constrain $L_{ m X<2 \, keV}/{ m SFR}$, the soft-band X-ray luminosity measured per unit star formation rate (SFR), strongly disfavoring values lower than $\approx 10^{39.5} \, { m erg} \;{ m s}^{-1} \;{ m M}_{\odot}^{-1} \;{ m yr}$. This conclusion is derived from semi-numerical models of the 21-cm signal, specifically focusing on contributions from atomic cooling galaxies that host PopII stars. In this work, we first reproduce the bounds on $L_{ m X<2 \, keV}/{ m SFR}$ and other parameters using a pipeline that combines machine learning emulators for the power spectra and the intergalactic medium characteristics, together with a standard Markov chain Monte Carlo parameter fit. We then use this approach when including molecular cooling galaxies that host PopIII stars in the cosmic dawn 21-cm signal, and show that lower values of $L_{ m X<2 \, keV}/{ m SFR}$ are hence no longer strongly disfavored. The revised HERA bound does not require high-redshift X-ray sources to be significantly more luminous than high-mass X-ray binaries observed at low redshift.
研究の動機と目的
- z ≈ 8および10における21-cmパワースペクトルのHERA上界を再評価し、以前は低L_X<2keV/SFR値を強く否定していた。
- 第III族星を宿す分子冷却銀河(MCGs)の導入が、SFR単位あたりのX線輝度に関する制約にどのように影響するかを調査する。
- 機械学習エミュレータを構築・検証し、21-cmパワースペクトル、光学的厚さ(τ_e)、中性水素分率(x_HI)を、ベイズ的パrameter推論を高速化するために用いる。
- 以前の低L_X<2keV/SFR値に対する強い否定的評価が、主にMCG寄与を無視していたことに起因し、宇宙暁期の21-cm信号に顕著な影響を与えることの証明
提案手法
- 深層ニューラルネットワークを用いて、宇宙論的および天体物理学的パラメータの関数として21-cmパワースペクトル、τ_e、x_HIをエミュレートする機械学習パイプラインを開発した。
- パラメータはラテンハイパーボックスサンプリングで選択され、安定性を高めるために[-1, 1]に正規化された。
- z ≈ 8および10における高・低パワー21-cm信号を区別するため、ReLU活性化関数、バッチ正則化、ドロップアウト(10%)、シグモイド出力を持つ信号分類器を用いた。
- パイプラインはエミュレータと標準的なマルコフ連鎖モンテカルロ(MCMC)サンプラーを統合し、L_X<2keV/SFRパラメータのベイズ的推論を実行した。
- MCGsを含む・含まないの両方のシナリオを比較することで、MCG寄与がHERA制約に与える影響を直接評価可能となった。
- 損失関数はアダム最適化法を用いて最小化され、早期停止と学習率の段階的減少が適用され、最良の性能を示したモデル重みが保持された。
実験結果
リサーチクエスチョン
- RQ1第III族星を宿す分子冷却銀河(MCGs)の導入が、L_X<2keV/SFRに関するHERA制約を変えるか?
- RQ2機械学習エミュレータは、宇宙論的推論に十分な精度で21-cmパワースペクトルおよび関連するグローバル量(τ_e、x_HI)を再現できるか?
- RQ3MCGsを含めた21-cm信号モデルと、原子冷却銀河(ACGs)のみのモデルを比較した場合、L_X<2keV/SFRのマージナライズド事後分布はどのように変化するか?
- RQ4MCGsの寄与により、HERAの21-cmパワースペクトル上界を満たすために必要なSFR単位あたりのX線輝度は、どの程度低減されるか?
- RQ5MCG寄与を適切に考慮した場合、L_X<2keV/SFR ≲ 10^39.5 erg s⁻¹ M☉⁻¹ yr⁻¹ に対する以前の強い否定的評価は、妥当であるか?
主な発見
- 第III族星を宿す分子冷却銀河(MCGs)の導入により、かつては高い有意水準で除外されていた低L_X<2keV/SFR値に対する否定的評価が顕著に弱まった。
- 見直されたHERAの制約では、局所の高質量X線連星源を上回るほどにX線源が明るくならなくても、L_X<2keV/SFR ≲ 10^39.5 erg s⁻¹ M☉⁻¹ yr⁻¹ が許容されるようになった。
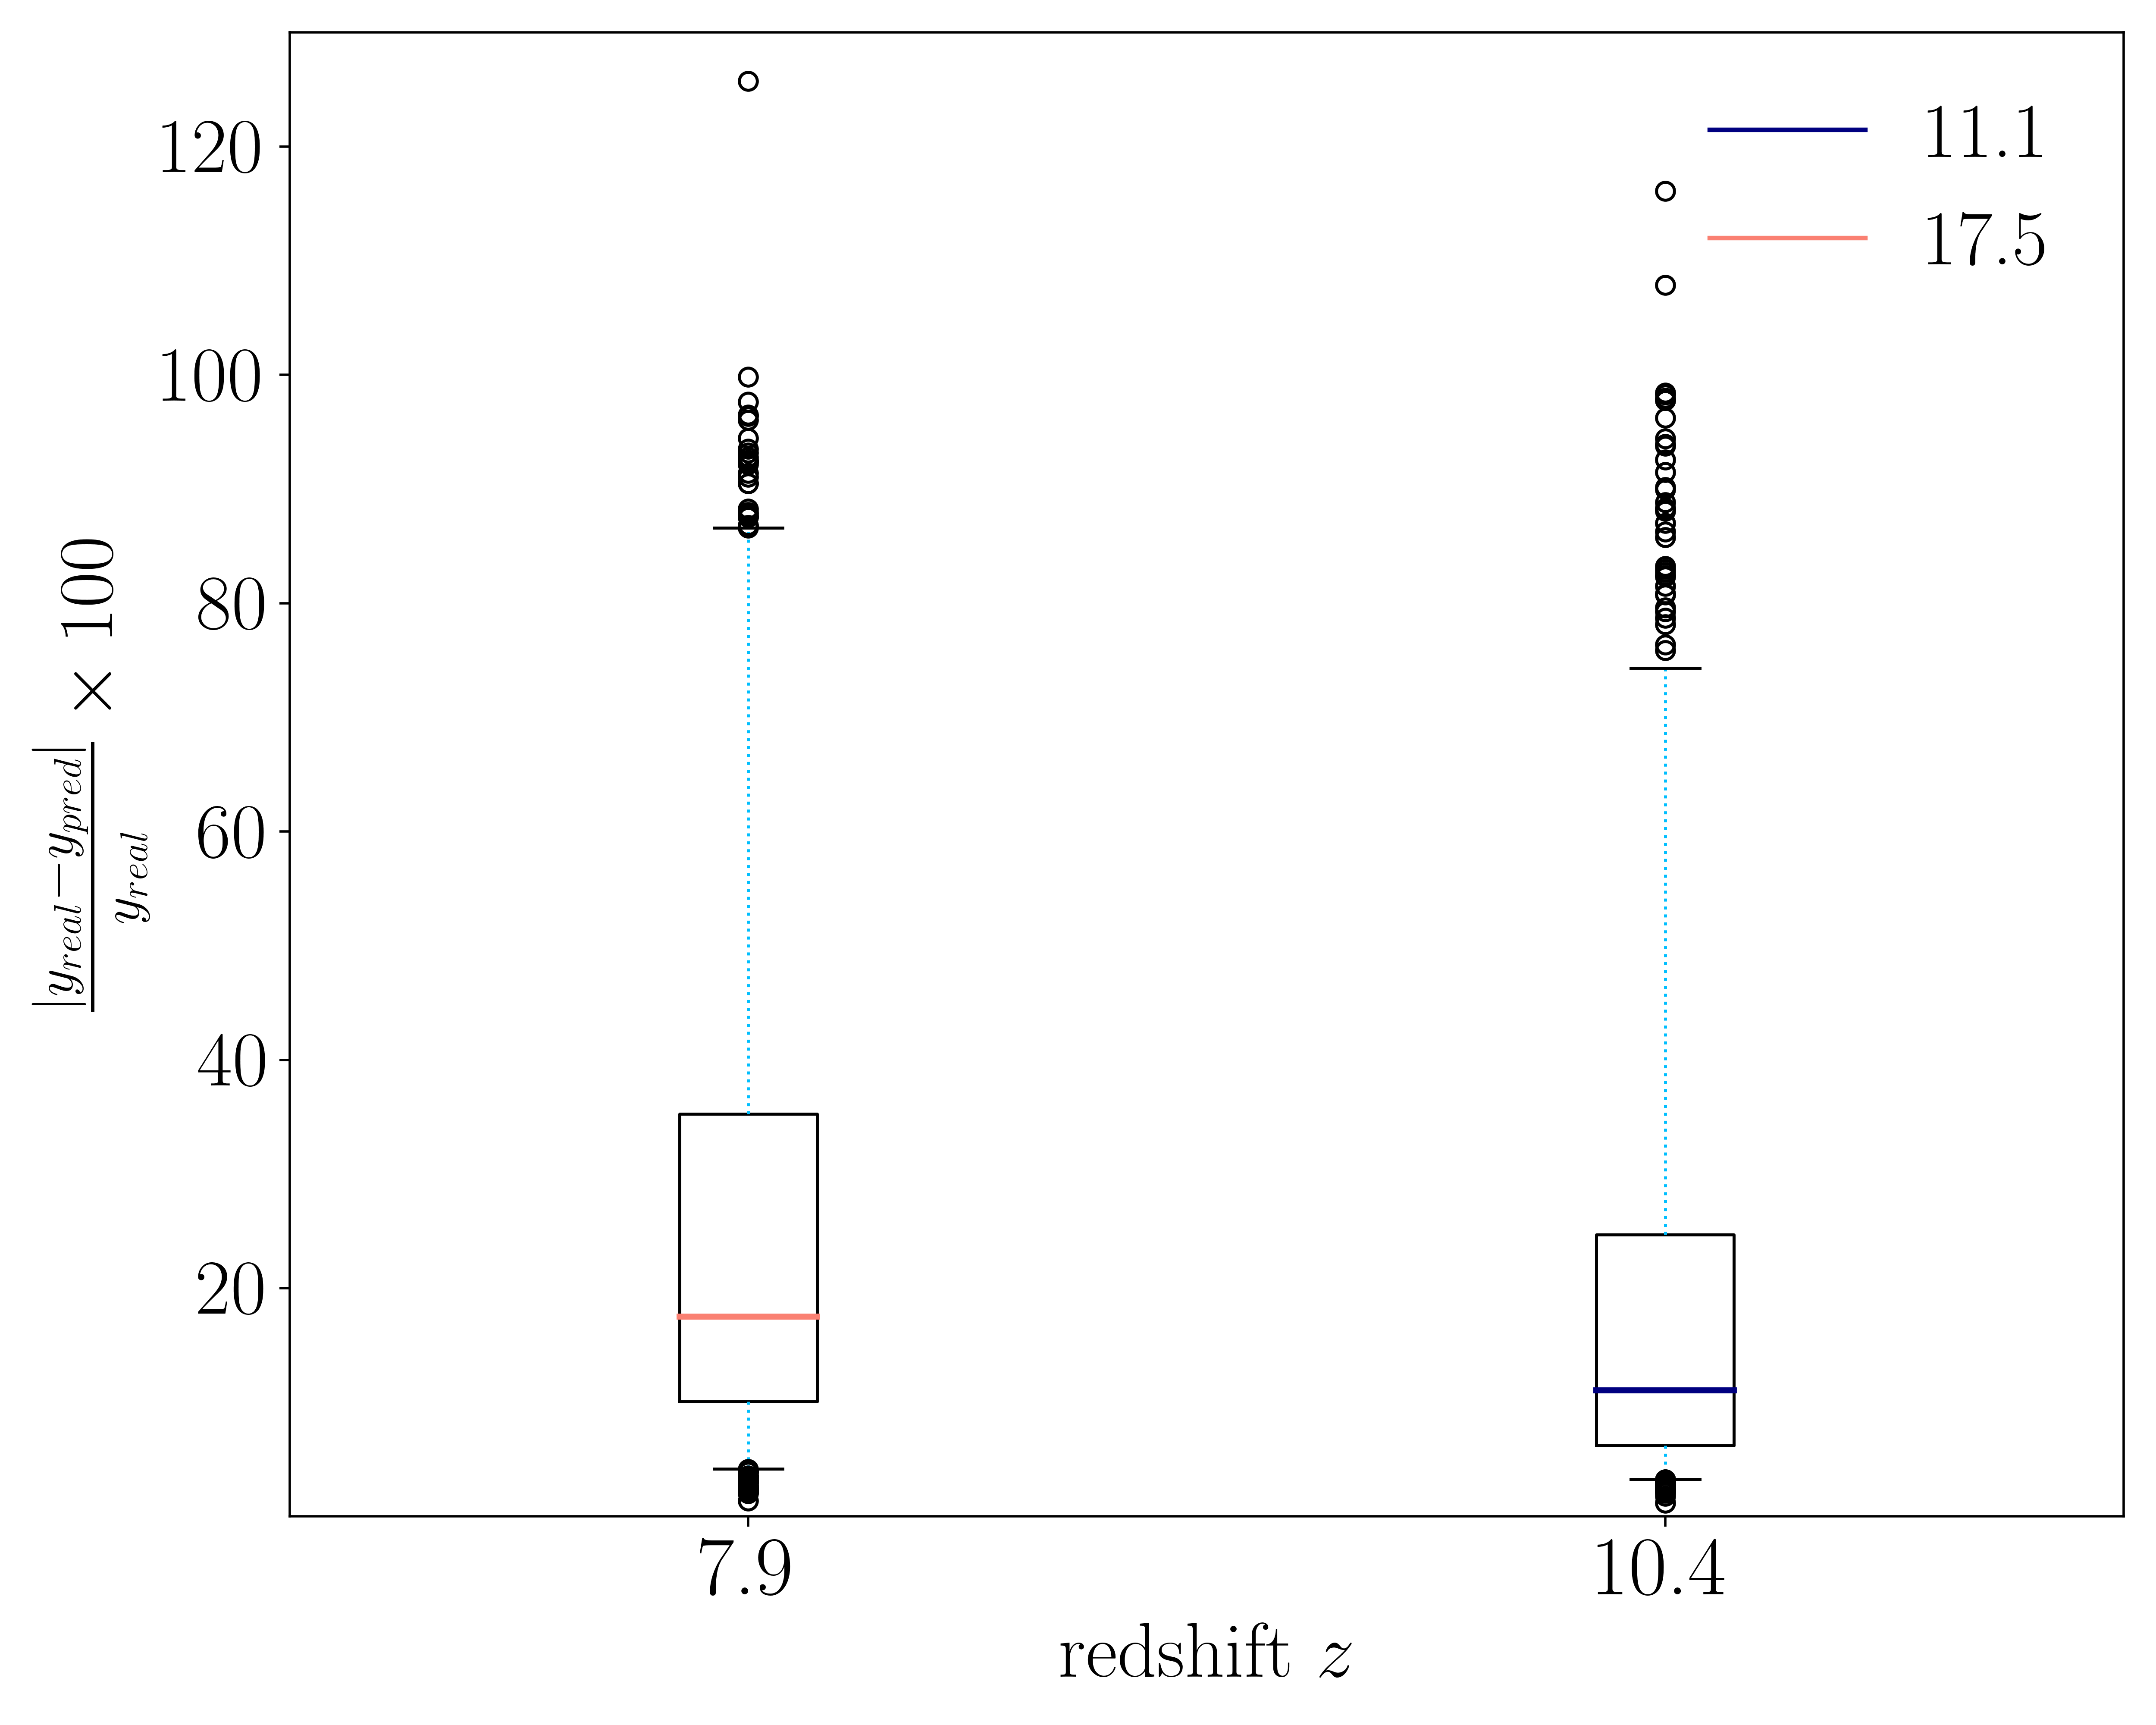
- 21-cmパワースペクトル、τ_e、x_HIの機械学習エミュレータは高い精度を達成しており、中央値損失が1%未満、16–84百分位範囲が安定した性能を示している。
- MCMCパイプラインで用いられた信号分類器は97%以上の精度を達成し、高パワー・低パワー21-cm信号領域の信頼性ある区別が可能となった。
- MCGsを含めた場合、L_X<2keV/SFRの事後分布は低値側にシフトし、MCGsが極端に高いX線輝度を必要としない状況でも、観測データを十分に説明できるほどの加熱およびイオン化を引き起こせることを示している。
- 本研究は、MCGsを無視することで、原子冷却銀河が示さねばならないX線効率が過剰に高めに見積もられることになることを示しており、21-cmモデリングにおいて初期世代の星形成を組み込む重要性を強調している。
より良い研究を、今すぐ始めましょう
論文の読解から最終レビューまで、研究時間を劇的に削減しましょう。
クレジットカード登録不要
このレビューはAIが作成し、人間の編集者が確認しました。