[論文レビュー] How Powerful are Graph Neural Networks?
tldr: 本論文はGNNの表現力を分析し、GNNは Weisfeiler-Lehman テストと同等かそれ以下の力しか持たないことを示し、WLレベルの表現力を持つ Graph Isomorphism Network (GIN) を導入する。GIN はグラフ分類ベンチマークで理論を実証する。
Graph Neural Networks (GNNs) are an effective framework for representation learning of graphs. GNNs follow a neighborhood aggregation scheme, where the representation vector of a node is computed by recursively aggregating and transforming representation vectors of its neighboring nodes. Many GNN variants have been proposed and have achieved state-of-the-art results on both node and graph classification tasks. However, despite GNNs revolutionizing graph representation learning, there is limited understanding of their representational properties and limitations. Here, we present a theoretical framework for analyzing the expressive power of GNNs to capture different graph structures. Our results characterize the discriminative power of popular GNN variants, such as Graph Convolutional Networks and GraphSAGE, and show that they cannot learn to distinguish certain simple graph structures. We then develop a simple architecture that is provably the most expressive among the class of GNNs and is as powerful as the Weisfeiler-Lehman graph isomorphism test. We empirically validate our theoretical findings on a number of graph classification benchmarks, and demonstrate that our model achieves state-of-the-art performance.
研究の動機と目的
- Motivate and formalize the need to understand the representational capacity of GNNs for graphs.
- Characterize the discriminative power of common GNN variants in distinguishing graph structures.
- Propose a maximally powerful GNN (GIN) that matches WL-test power and validate empirically on benchmarks.
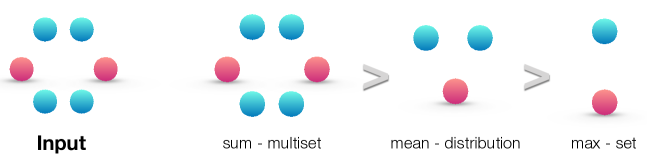
- Compare less powerful aggregators (mean, max) and 1-layer perceptrons to illustrate limitations.
- Demonstrate state-of-the-art or competitive performance on graph classification tasks while highlighting the role of expressiveness.
提案手法
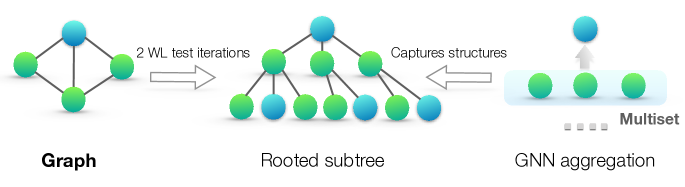
- Model GNN aggregation as multiset functions over neighbor features and analyze injectiveness of these aggregations.
- Show that any aggregation-based GNN is at most as powerful as the WL test (WL distinguishability).
- Prove that injective neighbor aggregation and injective graph readout yield WL-level power.
- Develop Graph Isomorphism Network (GIN) using sum-based injective multiset functions via deep multisets (Lemma 5) and MLPs (Corollary 6).
- Propose a graph-level readout that concatenates READOUT across all layers to capture information from all depths (Jumping Knowledge style).
- Compare GIN with variants using mean/max pooling and 1-layer perceptrons to illustrate expressiveness differences.
実験結果
リサーチクエスチョン
- RQ1Can GNNs distinguish graph structures as effectively as the Weisfeiler-Lehman test?
- RQ2What aggregation/readout conditions are required for a GNN to be as powerful as WL?
- RQ3How do common GNN variants (GCN, GraphSAGE with mean/max pooling) fare in distinguishing simple graph structures?
- RQ4Can we design a simple architecture (GIN) that achieves WL-level expressiveness and tractable learning?
- RQ5Do more powerful GNNs translate to better performance on graph classification benchmarks?
主な発見
| Datasets | IMDB-B | IMDB-M | RDT-B | RDT-M5K | COLLAB | MUTAG | PROTEINS | PTC | NCI1 |
|---|---|---|---|---|---|---|---|---|---|
| WL subtree | 73.8 ± 3.9 | 50.9 ± 3.8 | 81.0 ± 3.1 | 52.5 ± 2.1 | 78.9 ± 1.9 | 90.4 ± 5.7 | 75.0 ± 3.1 | 59.9 ± 4.3 | 86.0 ± 1.8 |
| DCNN | 49.1 | 33.5 | – | – | 52.1 | 67.0 | 61.3 | 56.6 | 62.6 |
| PatchySan | 71.0 ± 2.2 | 45.2 ± 2.8 | 86.3 ± 1.6 | 49.1 ± 0.7 | 72.6 ± 2.2 | 92.6 ± 4.2 | 75.9 ± 2.8 | 60.0 ± 4.8 | 78.6 ± 1.9 |
| DGCNN | 70.0 | 47.8 | – | – | 73.7 | 85.8 | 75.5 | 58.6 | 74.4 |
| AWL | 74.5 ± 5.9 | 51.5 ± 3.6 | 87.9 ± 2.5 | 54.7 ± 2.9 | 73.9 ± 1.9 | 87.9 ± 9.8 | – | – | – |
| GIN-Sum (Sum–MLP, GIN-0) | 75.1 ± 5.1 | 52.3 ± 2.8 | 92.4 ± 2.5 | 57.5 ± 1.5 | 80.2 ± 1.9 | 89.4 ± 5.6 | 76.2 ± 2.8 | 64.6 ± 7.0 | 82.7 ± 1.7 |
| GIN-Sum (Sum–MLP, GIN-ε) | 74.3 ± 5.1 | 52.1 ± 3.6 | 92.2 ± 2.3 | 57.0 ± 1.7 | 80.1 ± 1.9 | 89.0 ± 6.0 | 75.9 ± 3.8 | 63.7 ± 8.2 | 82.7 ± 1.6 |
| GIN-Sum–1-Layer | 74.1 ± 5.0 | 52.2 ± 2.4 | 90.0 ± 2.7 | 55.1 ± 1.6 | 80.6 ± 1.9 | 90.0 ± 8.8 | 76.2 ± 2.6 | 63.1 ± 5.7 | 82.0 ± 1.5 |
| Mean–MLP | 73.7 ± 3.7 | 52.3 ± 3.1 | 50.0 ± 0.0 | 20.0 ± 0.0 | 79.2 ± 2.3 | 83.5 ± 6.3 | 75.5 ± 3.4 | 66.6 ± 6.9 | 80.9 ± 1.8 |
| Mean–1-Layer (GCN) | 74.0 ± 3.4 | 51.9 ± 3.8 | 50.0 ± 0.0 | 20.0 ± 0.0 | 79.0 ± 1.8 | 85.6 ± 5.8 | 76.0 ± 3.2 | 64.2 ± 4.3 | 80.2 ± 2.0 |
| Max–MLP | 73.2 ± 5.8 | 51.1 ± 3.6 | – | – | – | 84.0 ± 6.1 | 76.0 ± 3.2 | 64.6 ± 10.2 | 77.8 ± 1.3 |
| Max–1-Layer (GraphSAGE) | 72.3 ± 5.3 | 50.9 ± 2.2 | – | – | – | 85.1 ± 7.6 | 75.9 ± 3.2 | 63.9 ± 7.7 | 77.7 ± 1.5 |
- GNNs are at most as powerful as the WL test in distinguishing graph structures.
- If neighbor aggregation and graph readout are injective, GNNs can be as powerful as the WL test.
- Popular variants like GCN and GraphSAGE with mean or max pooling cannot distinguish certain simple graph structures.
- GIN achieves WL-level expressiveness by using injective multiset functions parameterized by MLPs (deep multisets).
- Graph-level readout across multiple depths preserves WL-like discriminative power and improves performance on benchmarks.
- Empirical results show GIN matches or exceeds baselines in many graph classification datasets.
より良い研究を、今すぐ始めましょう
論文設計から論文執筆まで、研究時間を劇的に削減しましょう。
クレジットカード登録不要
このレビューはAIが作成し、人間の編集者が確認しました。