[論文レビュー] Implications for the non-Gaussianity of curvature perturbation from pulsar timing arrays
本論文は、複数のPTAデータを組み合わせて、スカラー誘起重力波を介した曲率攪乱の局所型非ガウス性を制約し、PBH過剰生成を避けるために |F_NL| ≲ 13.9 および -13.9 ≲ F_NL ≲ -0.1 を見出した。
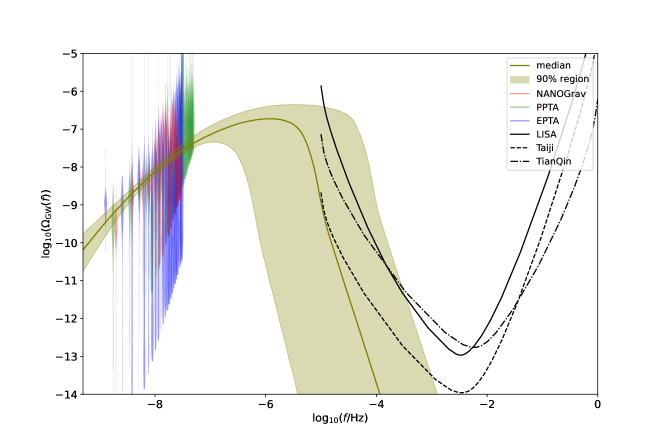
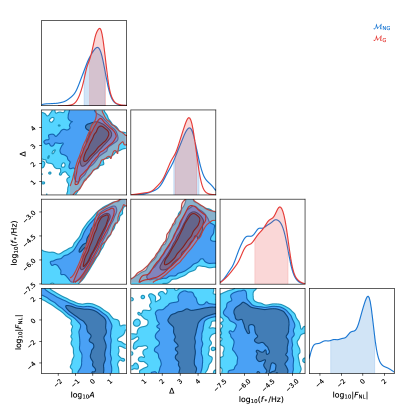
The recently released data by pulsar timing array (PTA) collaborations present strong evidence for a stochastic signal consistent with a gravitational-wave background. Assuming this signal originates from scalar-induced gravitational waves, we jointly use the PTA data from the NANOGrav 15-yr data set, PPTA DR3, and EPTA DR2 to probe the small-scale non-Gaussianity. We put the first-ever constraint on the non-Gaussianity parameter, finding $|F_\mathrm{NL}|\lesssim 13.9$ for a lognormal power spectrum of the curvature perturbations. Furthermore, we obtain $-13.9 \lesssim F_\mathrm{NL}\lesssim -0.1$ to prevent excessive production of primordial black holes. Moreover, the multi-band observations with the space-borne gravitational-wave detectors, such as LISA/Taiji/TianQin, will provide a complementary investigation of primordial non-Gaussianity. Our findings pave the way to constrain inflation models with PTA data.
研究の動機と目的
- 小規模なスケールの原始的曲率攪乱の非ガウス性をPTAが検出した確率論的重力波背景に対して調べる動機づけ。
- 局所型非ガウス性(F_NL)がスカラー誘起重力波と原始ブラックホール生成に与える影響を定量化する。
- NANOGrav 15-yr、PPTA DR3、EPTA DR2データを組み合わせたベイズ推論フレームワークを用いてF_NLおよび関連パラメータを制約することを示す。
提案手法
- 局所型展開 R(x) = R_G(x) + F_NL( R_G^2(x) - <R_G^2> ) を採用し、F_NLを非ガウス化曲率攪乱と結びつける。
- 非ガウス寄与を捉える有効な曲率攪乱パワースペクトル P_R^{NG} = P_R + F_NL^2 ∫∫ P_R(uk)P_R(vk)/(u^2 v^2) du dv を用いる。
- SIGWのエネルギー密度 Omega_GW(k) を、放射期伝達関数 T(u,v) を用いた2次ソース項を介して計算する。
- k と周波数 f の関係を k = 2πf として対数正規スペクトルで P_R(k) をモデル化し、宇宙進化後の Omega_GW,0(f) を得る。
- 66点多バンドPTAスペクトルを用いたベイズ推定を行い、A、Δ、f_*、および |F_NL|を含むパラメータを constraint する。
実験結果
リサーチクエスチョン
- RQ1PTA測定がSIGW由来と仮定した小規模スケールの局所非ガウス性パラメータ F_NL の許容範囲はどれくらいか。
- RQ2F_NLがSIGWスペクトルとPTA周波数窓内のPBH存在量に与える影響はどうなるか。
- RQ3NANOGrav、PPTA、EPTAを結合したデータは、単一PTA分析を超えてF_NLの制約を強化できるか。
- RQ4F_NLの制約は、非ガウスな曲率攪乱を生成するインフレーションモデル(例:カルツァンモデル)にどのような示唆をもたらすか。
主な発見
- 結合PTA分析は、P_R(k)が対数正規である場合、|F_NL| ≲ 13.9 を示す。
- PBH制約を許容すると範囲は -13.9 ≲ F_NL ≲ -0.1 へと狭まり、過剰PBH生成を回避する。
- 振幅パラメータは A = 1.06^{+5.20}_{-1.02} で、Δおよび f_* の値は結果に示され、NANOGravのみ分析より精度が向上。
- 正負の F_NL は SIGWs に与える影響で縮退するため、PBHを用いた縮退解消が有効である。
- 結果は、r_D (r_D ≳ 0.05 で95%信頼区間; F_NL ≲ -0.1 のときより強い場合) の非無視可能なカルツァン崩壊分を示唆し、インフレーションモデルの妥当性に影響を与える。
より良い研究を、今すぐ始めましょう
論文設計から論文執筆まで、研究時間を劇的に削減しましょう。
クレジットカード登録不要
このレビューはAIが作成し、人間の編集者が確認しました。