
[論文レビュー] Inform Product Change through Experimentation with Data-Driven Behavioral Segmentation
本論文は、Web製品開発におけるA/Bテストにおいて、実験前の製品コンponentsへのユーザーの関与を用いて意味のあるユーザー層を生成する、データ駆動型の行動セグメンテーションフレームワークを提案する。処理効果をセグメントレベルで分析することで、Yahoo Financeのリデザインが、見積もりとメッセージボードに注目するユーザーにおいて1回あたりのコンテンツ量(CPV)を10.3%低下させたことが判明した—これは、テストグループにおけるユーザー生成コンテンツの減少に起因するもので、その結果、ターゲットとなるデザイン修正が行われ、CPVは6.1%回復し、APVは35.1%増加した。
Online controlled experimentation is widely adopted for evaluating new features in the rapid development cycle for web products and mobile applications. Measurement of the overall experiment sample is a common practice to quantify the overall treatment effect. In order to understand why the treatment effect occurs in a certain way, segmentation becomes a valuable approach to a finer analysis of experiment results. This paper introduces a framework for creating and utilizing user behavioral segments in online experimentation. By using the data of user engagement with individual product components as input, this method defines segments that are closely related to the features being evaluated in the product development cycle. With a real-world example, we demonstrate that the analysis with such behavioral segments offered deep, actionable insights that successfully informed product decision-making.
研究の動機と目的
- A/Bテストにおける処理効果の『なぜ』を、全体的な指標の変化を超えて解明すること。
- 製品機能に関連した行動的に意味のあるユーザー層を生成する手法を開発すること。
- 実験結果のセグメントレベル分析を通じて、製品開発における実行可能なインサイトを提供すること。
- セグメントが処理とは独立した実験前データに基づいて定義されることで、バイアスを回避すること。
- フレームワークの実際の製品意思決定への影響を、測定可能な改善事例を通じて示すこと。
提案手法
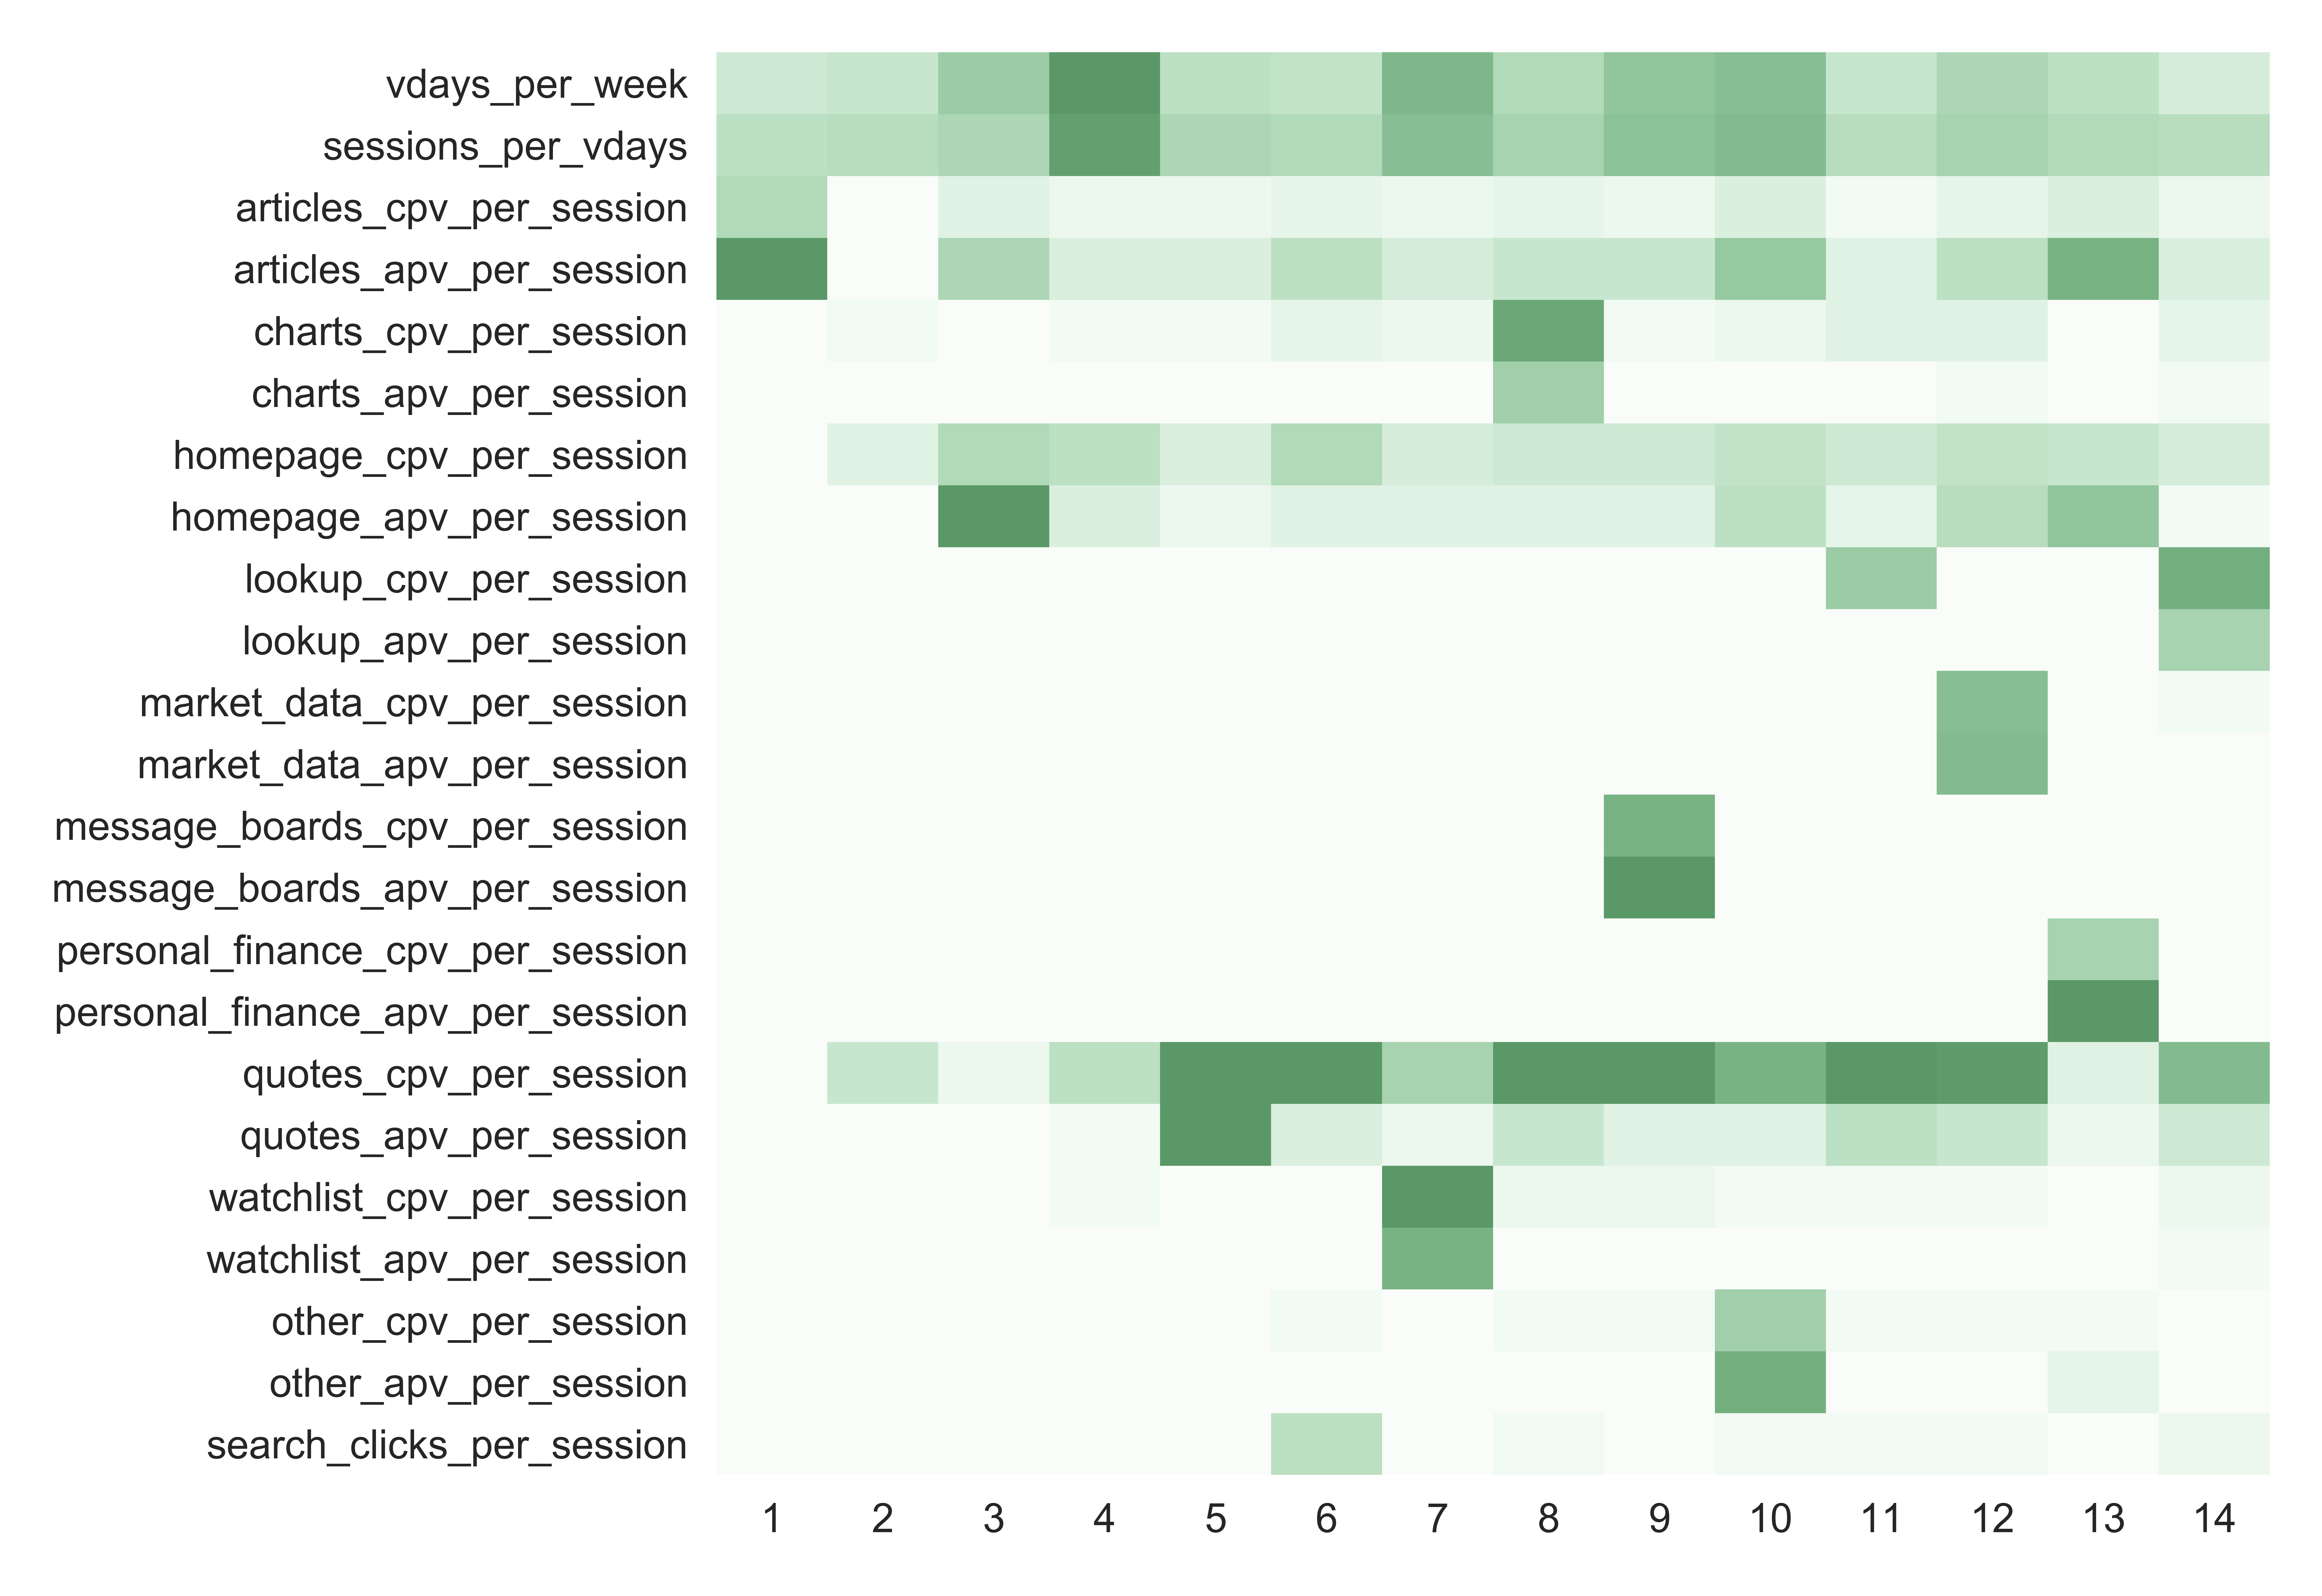
- 特定の製品コンponents(例:ホームページ、見積もり、メッセージボード)へのユーザー関与に基づいて行動特徴を定義する。
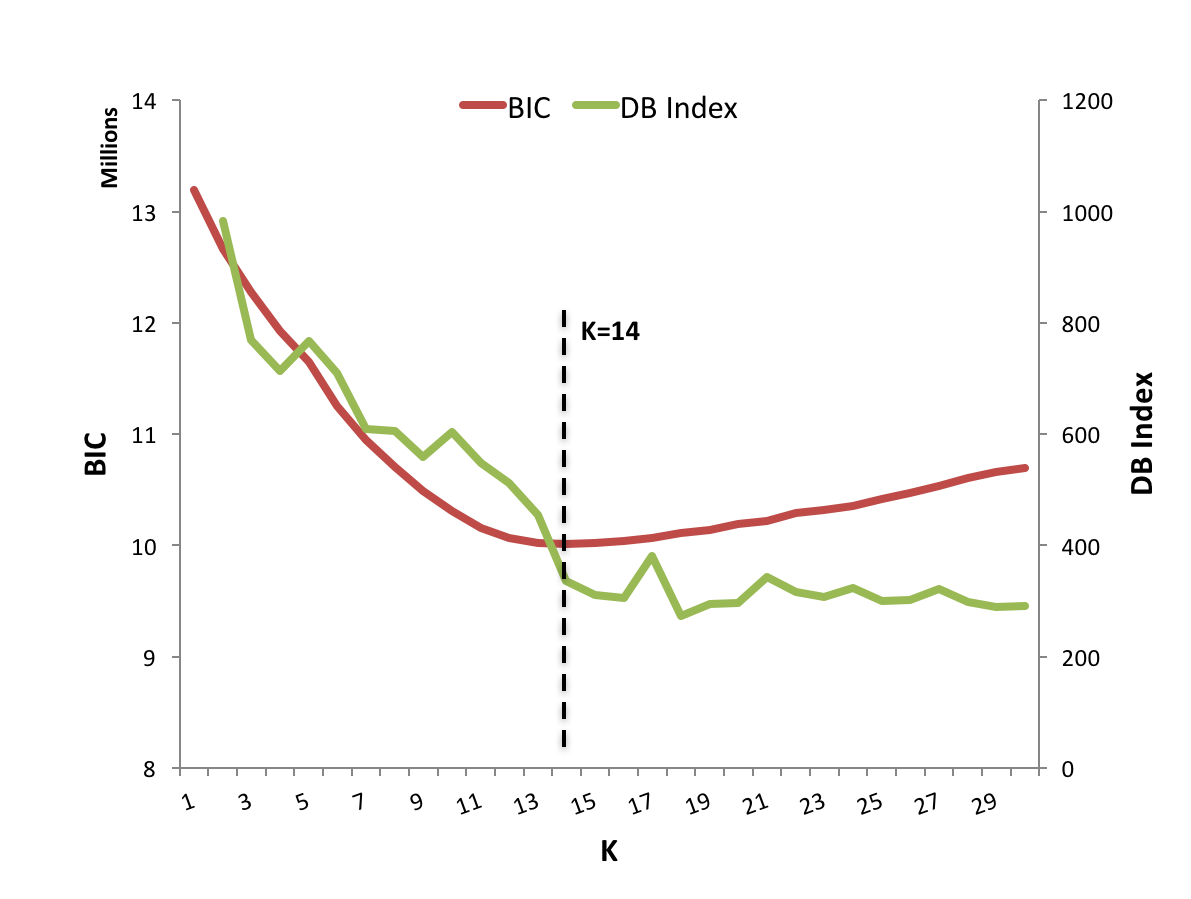
- 非教師あり学習を用いて、実験前のデータから互いに排他的でかつ網羅的なセグメントにユーザーをクラスタリングする。
- 機能コンponentsにおける関与パターンに応じて、距離に基づくクラスタリングを適用してユーザーをグループ化する。
- 処理とは独立した実験前行動データのみを用いることで、セグメント定義が処理とは独立していることを保証する。
- CPV、APV、セッション数といった主要指標における処理効果を、セグメントレベルで分析する。
- フォローアップA/Bテストを通じて修正を検証し、変更前後におけるセグメントレベルの成果を比較する。
実験結果
リサーチクエスチョン
- RQ1行動セグメンテーションは、集計指標を超えたA/Bテスト結果の解釈をどのように改善できるか?
- RQ2製品実験における処理効果のばらつきを最も的確に予測するユーザー関与パターンは何か?
- RQ3セグメントレベルのインサイトは、どのように実行可能な製品開発意思決定を導くことができるか?
- RQ4実験期間中のデータを用いたセグメント定義にはどのようなバイアスのリスクがあるか?
- RQ5セグメントレベル分析は、予期しない処理効果の根本原因をどの程度まで明らかにできるか?
主な発見
- Yahoo Financeのリデザインにより、全体集団において1回あたりのコンテンツ量(CPV)が著しく10.3%低下したが、主に「見積もり&メッセージボード」セグメントに起因した。
- セグメントレベルの分析により、「見積もり&メッセージボード」グループにおけるCPV低下は、テストグループでのユーザー生成コンテンツの減少に起因しており、サンプルサイズが小さいことによるネットワーク効果であったことが判明した。
- リモートの見積もり関連モジュールをホーム画面に再追加した後、CPVは6.1%低下に回復し、フォローアップテストではAPVが35.1%増加した。
- 「ホーム画面&ハイブリッド高」および「ホーム画面&ハイブリッド中程度」セグメントが、修正後で最も大きな改善を示し、CPVはそれぞれ9%および6%増加した。
- 修正後も全体的な処理効果は有意であったが、セグメントレベルの分析が根本原因を特定し、解決策を導く上で不可欠であった。
- フレームワークは、実験前データに基づいてセグメントを定義することで、バイアスを効果的に回避し、処理群とコントロール群の有効な比較を可能にした。
より良い研究を、今すぐ始めましょう
論文の読解から最終レビューまで、研究時間を劇的に削減しましょう。
クレジットカード登録不要
このレビューはAIが作成し、人間の編集者が確認しました。