
[論文レビュー] Investigating Mutual Coupling in the Hydrogen Epoch of Reionization Array and Mitigating its Effects on the 21-cm Power Spectrum
本論文は、21cmパワー スペクトルへの影響を軽減するため、半解析的シミュレーションとフレアートレートフィルタリングを用いて、ハイドロゲン再電離時代アレイ(HERA)における相互結合の影響を調査している。シミュレーションによる結合特徴は観測データと定性的に一致するが、約1桁小さい強度であるため、モデルに反映されていない結合メカニズムが存在すると示唆される。フレアートレートフィルタリングにより結合が約100倍軽減されるが、依然として顕著な汚染が残っており、EoR検出のための高度な低減戦略が不可欠である。
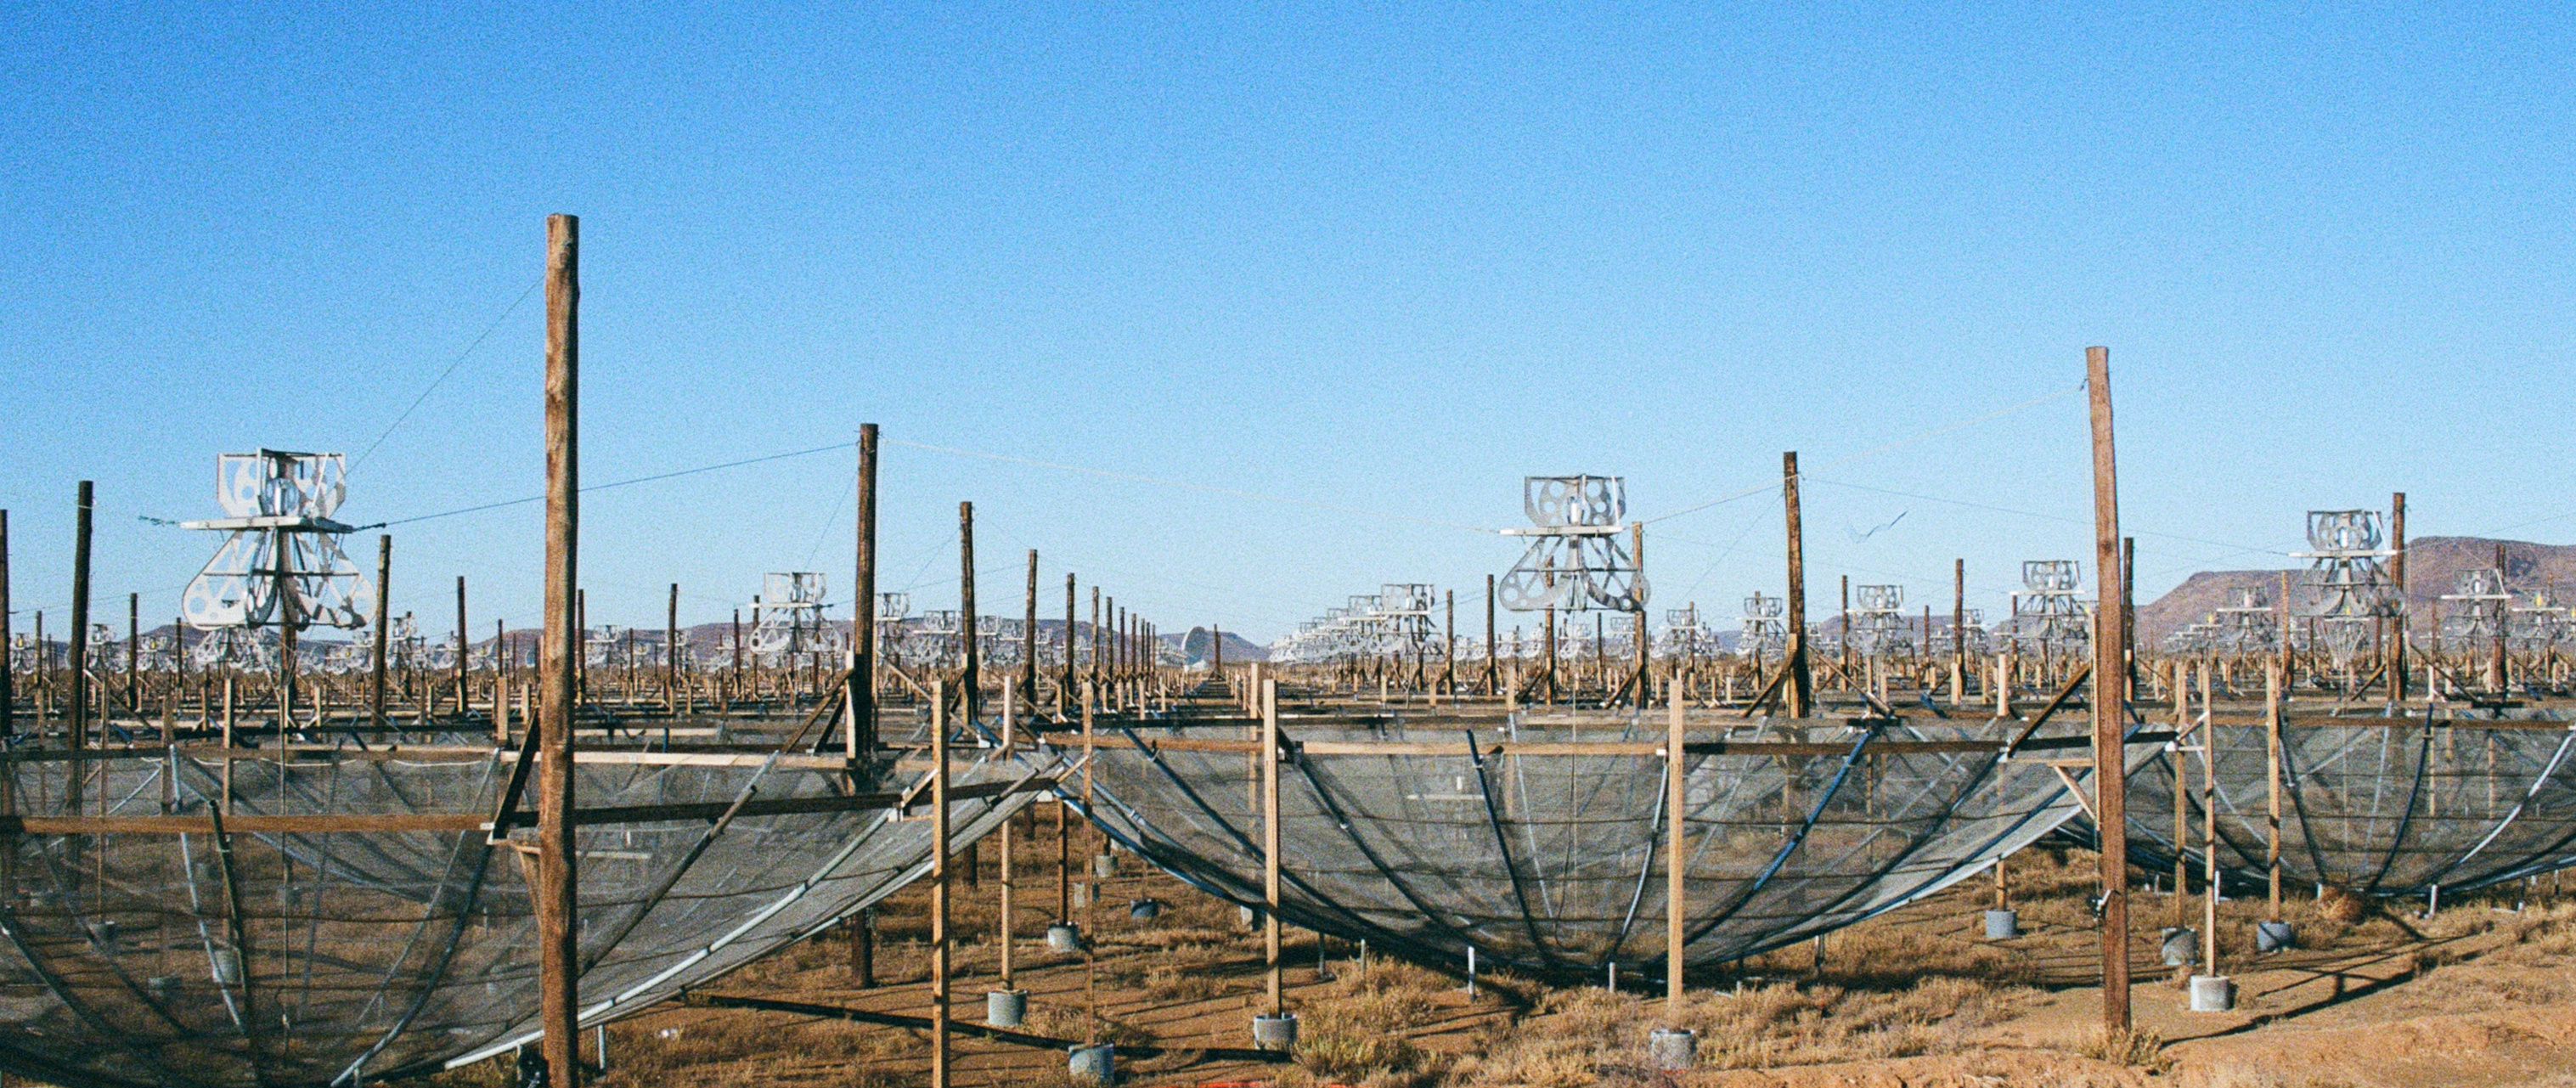
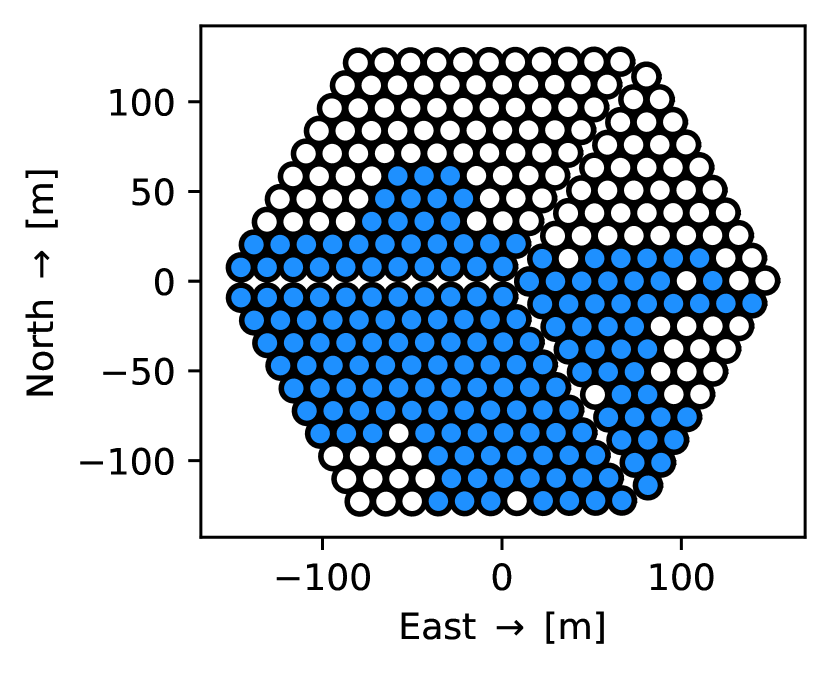
Interferometric experiments designed to detect the highly redshifted 21-cm signal from neutral hydrogen are producing increasingly stringent constraints on the 21-cm power spectrum, but some k-modes remain systematics-dominated. Mutual coupling is a major systematic that must be overcome in order to detect the 21-cm signal, and simulations that reproduce effects seen in the data can guide strategies for mitigating mutual coupling. In this paper, we analyse 12 nights of data from the Hydrogen Epoch of Reionization Array and compare the data against simulations that include a computationally efficient and physically motivated semi-analytic treatment of mutual coupling. We find that simulated coupling features qualitatively agree with coupling features in the data; however, coupling features in the data are brighter than the simulated features, indicating the presence of additional coupling mechanisms not captured by our model. We explore the use of fringe-rate filters as mutual coupling mitigation tools and use our simulations to investigate the effects of mutual coupling on a simulated cosmological 21-cm power spectrum in a "worst case" scenario where the foregrounds are particularly bright. We find that mutual coupling contaminates a large portion of the "EoR Window", and the contamination is several orders-of-magnitude larger than our simulated cosmic signal across a wide range of cosmological Fourier modes. While our fiducial fringe-rate filtering strategy reduces mutual coupling by roughly a factor of 100 in power, a non-negligible amount of coupling cannot be excised with fringe-rate filters, so more sophisticated mitigation strategies are required.
研究の動機と目的
- HERA実験における21cmパワー スペクトル測定に及ぼす相互結合の影響を理解すること。
- フレアートレートフィルタリングが相互結合の影響をどれほど効果的に低減できるかを評価すること。
- シミュレーションと観測された結合特徴の乖離を特定し、欠落した物理的メカニズムを明らかにすること。
- 極端な前景条件下における現在の低減手法の頑健性を評価すること。
- より良いEoR信号検出を実現するための将来のハードウェアおよびソフトウェアソリューションを導くこと。
提案手法
- 要素応答関数とアレイ幾何学に基づく、計算効率の高い一次近似の半解析的相互結合モデルを採用した。
- matvisとhera_simを用いた可視性シミュレーションにより、モデル化された結合効果を含む合成データを生成した。
- 可視性データにフレアートレートフィルタリングを適用し、時間変動する結合特徴を抑制した。
- 12回の観測夜分の実際のHERAデータと、シミュレーションによる結合特徴を比較し、モデルの妥当性を検証した。
- フィルタリング済みおよび未フィルタリングのデータに対して、hera_pspecツールを用いてパワー スペクトル推定を実施し、汚染度を定量した。
- LSTバイニングによるキャリブレーションとインpainting技術を用いて、データ欠損を処理し、ダイナミックレンジを向上させた。
実験結果
リサーチクエスチョン
- RQ1一次近似の半解析的シミュレーションは、HERAデータにおける観測された相互結合特徴をどの程度正確に再現できるか?
- RQ2フレアートレートフィルタリングは、21cmパワー スペクトルにおける相互結合をどの程度抑制できるか?
- RQ3フレアートレートフィルタリング後、どの程度の割合の結合汚染が残っており、その汚染はどこで最も顕著か?
- RQ4観測された結合特徴がシミュレーション結果よりも著しく明るい理由は何か?その乖離を説明するメカニズムは何か?
- RQ5明るい前景が存在する最悪の状況下で、相互結合はEoRウインドウにどのように影響を与えるか?
主な発見
- シミュレーションによる相互結合特徴は、HERAデータにおける観測特徴と定性的に一致するが、約1桁小さい強度であるため、モデルに反映されていない物理的結合メカニズムが存在すると示唆される。
- フレアートレートフィルタリングにより、相互結合パワーが約100倍に低減され、ダイナミックレンジが著しく向上したが、依然として顕著な残存汚染が残っている。
- 相互結合はEoRウインドウの広範囲にわたり汚染を引き起こしており、kモードの広い範囲で、期待される宇宙論的21cm信号よりも数個桁大きいパワーが観測されている。
- 最悪の状況(明るい前景)下では、相互結合がEoRウインドウの大部分でパワー スペクトルを支配し、感度を著しく制限する。
- シミュレーションと観測の間の乖離は、一次モデルが高次のまたは非局所的な結合効果を捉えていないことを示唆している。
- 一次結合シミュレーションは、完全な電磁界シミュレーションを必要とせず、低減手法のテストのための信頼できるベースラインを提供する。
より良い研究を、今すぐ始めましょう
論文の読解から最終レビューまで、研究時間を劇的に削減しましょう。
クレジットカード登録不要
このレビューはAIが作成し、人間の編集者が確認しました。