[論文レビュー] LIDA: A Tool for Automatic Generation of Grammar-Agnostic Visualizations and Infographics using Large Language Models
tldr: LIDAは、自然言語だけでなく直接操作も組み合わせたハイブリッドUIとPython APIを備えた、4モジュールのLLM駆動パイプライン。 grammar-agnostic な自動生成視覚化とデータ忠実なインフォグラフィックスを生成する
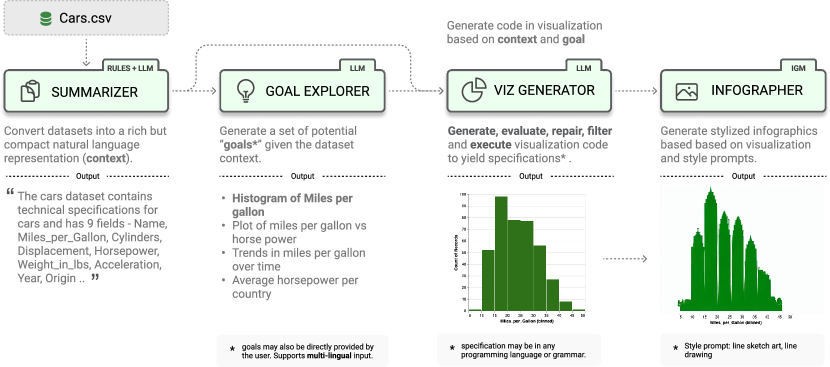
Systems that support users in the automatic creation of visualizations must address several subtasks - understand the semantics of data, enumerate relevant visualization goals and generate visualization specifications. In this work, we pose visualization generation as a multi-stage generation problem and argue that well-orchestrated pipelines based on large language models (LLMs) such as ChatGPT/GPT-4 and image generation models (IGMs) are suitable to addressing these tasks. We present LIDA, a novel tool for generating grammar-agnostic visualizations and infographics. LIDA comprises of 4 modules - A SUMMARIZER that converts data into a rich but compact natural language summary, a GOAL EXPLORER that enumerates visualization goals given the data, a VISGENERATOR that generates, refines, executes and filters visualization code and an INFOGRAPHER module that yields data-faithful stylized graphics using IGMs. LIDA provides a python api, and a hybrid user interface (direct manipulation and multilingual natural language) for interactive chart, infographics and data story generation. Learn more about the project here - https://microsoft.github.io/lida/
研究の動機と目的
- Convert dataset semantics into a compact natural language summary to ground visualization tasks.
- Enumerate relevant visualization goals and hypotheses from the data.
- Generate, refine, execute, and filter visualization code across multiple grammars.
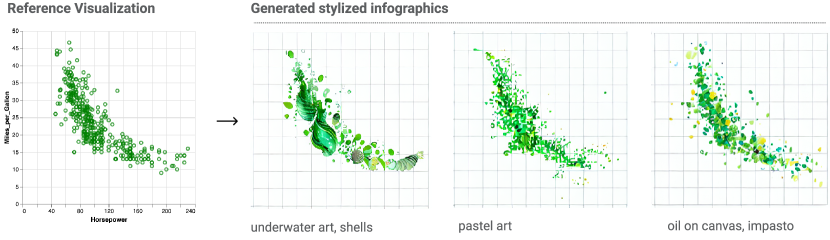
- Produce data-faithful, stylized infographics using text-conditioned image generation models.
- Offer a hybrid interface (direct manipulation and multilingual natural language) for interactive visualization and storytelling.
提案手法
- Summarizer converts data properties into a compact NL summary, optionally enriched by an LLM.
- Goal Explorer uses the summary to generate visualization questions/hypotheses and corresponding goals.
- VisGenerator creates code scaffolds for multiple grammars (e.g., Matplotlib, GGPlot, Plotly, Altair, Seaborn, Bokeh), fills stubs via LLM-generated code, and executes with sandboxed validation and filtering.
- Infographer applies data-faithful/stylized graphics using diffusion-based image generators (text-conditioned) to produce infographics.
- VizOps provides NL-based refinement, explanations, accessibility descriptions, self-evaluation and repair, and recommendations based on generated visualizations.
- The system is exposed via a Python API, a web API, and a multilingual, hybrid UI for interactive use.
実験結果
リサーチクエスチョン
- RQ1How can LLMs be orchestrasを orchestrated to generate visualization goals and grammar-agnostic specifications from data summaries?
- RQ2Can a multi-stage pipeline reliably produce data-faithful visualizations and aesthetically pleasing infographics across grammars?
- RQ3What metrics reliably evaluate the reliability and quality of LLM-enabled visualization pipelines?
- RQ4How can NL interactions and image generation models complement traditional visualization tooling to support diverse users?
主な発見
- The pipeline achieves a low visualization error rate of 3.5%.
- Using a compact NL data summary improves reliability over schema-only summaries in ablation studies.
- Enriching base summaries with LLM enrichment has variable impact depending on grammar; expressive grammars (e.g., Seaborn) show lower error rates.
- Self-evaluation and repair mechanisms via LLMs help identify semantic quality issues and enable automated corrections (e.g., suggesting a bar chart over a pie chart).
- The framework provides an end-to-end, grammar-agnostic approach that supports multiple grammars and the generation of both standard visualizations and data-driven infographics.
より良い研究を、今すぐ始めましょう
論文設計から論文執筆まで、研究時間を劇的に削減しましょう。
クレジットカード登録不要
このレビューはAIが作成し、人間の編集者が確認しました。